
 Last reviewed October 2026 by Megan Birot, Content Editor, OurTop10. Figures checked against the sources named in the article.
The short version: Sydney house prices are falling. The median house is $1,466,060 as at September 2026, down 5.4% over the quarter, and units are down 2.9% to $867,597. The cause is the cash rate, which rose to 4.35% in September 2026.
Where Sydney house prices sit now
August 2026 Cotality figures for Greater Sydney, with the change over the quarter:
- Houses — median $1,466,060, down 5.4%
- Units — median $867,597, down 2.9%
- All dwellings — median $1,198,596, down 4.7%
- Gross rental yield — 3.3%, the lowest of the three biggest capitals
Sydney has fallen further than either Melbourne or Brisbane. That is not a Sydney-specific problem; it is what happens to the most expensive market in the country when borrowing power contracts.
How the trend got here
The rate cycle is the trend
Sydney prices track the cash rate more closely than any other capital, because its prices sit furthest ahead of local incomes. More of a Sydney buyer’s purchase is borrowed, so a change in what banks will lend moves Sydney hardest — down now, and up first when rates eventually turn.
The cash rate is 4.35%, effective 12 August 2026. The next Reserve Bank decision is 29 September 2026 and forecasters disagree on it. Our Rate Prediction Index tracks what the futures market is pricing against what named economists are publicly forecasting.
Houses and units have split
Houses fell 4.6% over the quarter against 2.5% for units. The pattern is the same in Melbourne and Brisbane: the dearer the asset, the harder a borrowing squeeze hits it. Sydney units also pay a better yield than Sydney houses, at 4.3% against a citywide 3.3%.
What selling conditions look like
National auction clearance rates ran near 66% in February 2026 and finished July in the low 40s. Homes take a median 35 days to sell. Vendors are discounting 3.8% off asking. Capital city sales volumes are down 3.5% on the year, while regional sales rose 4.2%.
Rents did not follow prices down
Annual rental growth held at 5.9% in July 2026. Gross yields rose to 3.7% nationally — not because rents jumped, but because values fell faster than rents did. For a Sydney renter, the cost of waiting has gone up while the price of buying has come down.
Sydney house prices by region
Inner Sydney
The premium end has given back the most in dollar terms. Buyers here are less rate-constrained than most, but there are fewer of them and the pool thins quickly when credit tightens. Inner-city units have held far better than inner-city houses.
Middle ring
The established middle ring moves closest to the citywide average. These are family-house markets, and family houses are where the falls have concentrated.
Outer Sydney
The outer suburbs remain the entry point and are the most rate-sensitive part of the city, because buyers there are usually borrowing close to their limit. Infrastructure keeps improving in these corridors, which supports them over a long hold, but a rate rise bites here first.
For a suburb-level view rather than a citywide median, see our average house price in Sydney guide.
As at 27 September 2026, the OurTop10 Rate Prediction Index puts the chance of a rate rise at 85.1%, and 8 of the 10 economists on its panel expect a rise. The cash rate is 4.35%. Rate moves feed straight into borrowing power and prices. See the full index.

“Interest rates influence how much buyers can borrow, but they shouldn’t be the only factor driving a property decision. Buying the right property within your long-term budget will usually have a much greater impact on your financial future than trying to perfectly time the interest rate cycle.”
Mary Nebotakis
Managing Director – Natloans
What drives Sydney house prices
- Interest rates. The dominant factor, and currently working against prices. See borrowing power for what actually moves the number a bank will lend you.
- Population growth. Sydney keeps adding people faster than it adds homes, which puts a floor under the market that a rate cycle does not remove.
- Supply. Completions remain well short of what the city needs, and falling values remove the incentive to start new projects.
- Employment. Sydney’s job market holds up better than most in a downturn, which is part of why forced selling has stayed low.
Where Sydney goes from here
The next twelve months depend on the Reserve Bank, and anyone telling you otherwise is guessing at a decision that has not been made. What can be said with more confidence:
- Sellers who do not have to move are staying put. That withdrawal of stock is the main thing stopping falls from being larger, and it can reverse quickly if unemployment rises.
- Units are the more defensive half of the market and carry the better yield.
- The supply shortfall outlasts the rate cycle. It supported Sydney values through every previous downturn.
Over a fifteen-year hold this cycle is noise. Over three years it is not, and that difference should shape your decision more than any forecast.
What a Sydney home costs to hold
Enter a price and deposit. The calculator shows the monthly repayment and the household income a lender would want to see, using the 3% assessment buffer every Australian lender applies.
Built by OurTop10. Results are estimates for comparison only and are not credit advice. Figures stay in your browser and are not sent anywhere.
What this means for you
If you are buying
You are buying into a buyer’s market for the first time in years. Confirm your borrowing capacity before you shop, because it has moved. Negotiate — vendors are discounting and homes are sitting. Stress-test the repayment against a higher rate than today’s. Keep pre-approval current so you can move when the right place appears, and use our calculators to check the numbers yourself.
First-home buyers should check the First Home Owner Grant and whether the First Home Super Saver Scheme suits your situation. A Sydney mortgage broker can tell you which lenders treat your income best.
If you already own
A falling market only matters if you have to sell or refinance into it. Higher rates make it worth reviewing the loan annually rather than never — refinancing is where most owners find real money in a year like this one.
If you are investing
With capital growth negative, the rent is doing the work. Sydney units at 4.3% pay materially better than Sydney houses. Keep a buffer that survives another rate rise, and read our guide to buying an investment property before you commit.
How Sydney compares to the other capitals
- Sydney — $1,198,596 all dwellings, down 4.7%, yield 3.3%
- Brisbane — $1,048,880, down 2.7%, yield 3.4%. The only one of the three where units rose
- Melbourne — $780,550, down 3.9%, yield 4.0%
Sydney is the dearest and has fallen furthest. Brisbane has held up best. Melbourne is the cheapest of the three and pays the best rent relative to price. For the national picture, see our Australian property market guide.
Summing up
Sydney house prices are down 4.6% over the quarter and the reason is the cash rate. Whether that makes it a good time to buy depends on your own numbers — what you can borrow at 4.35%, and what you could carry if rates rose again from here.
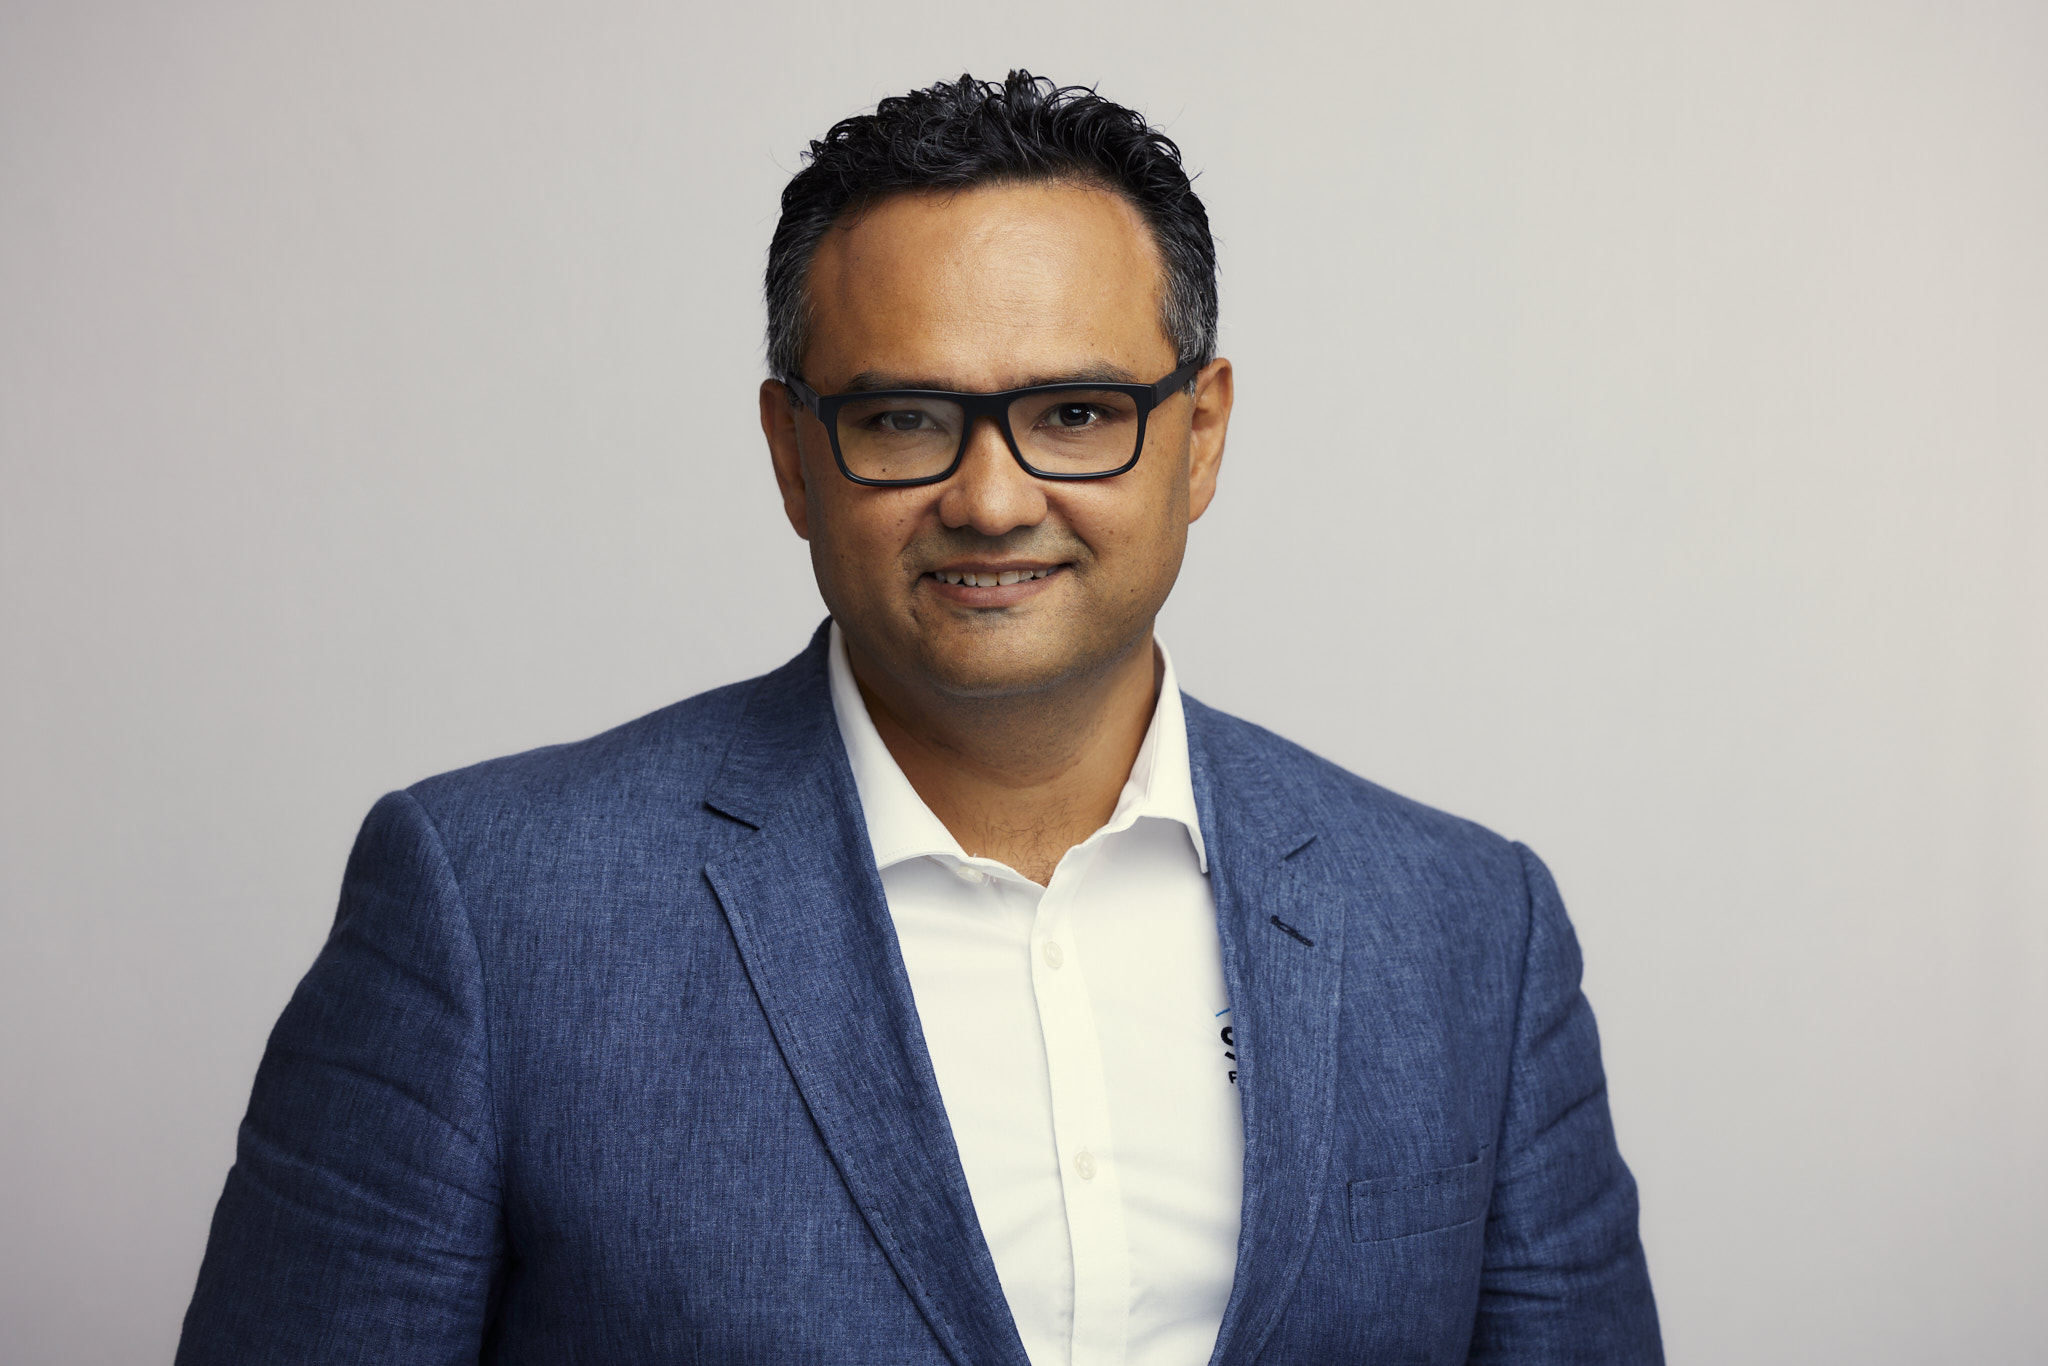
“Sydney has given back about 4.6% on houses over the quarter, and it is the cash rate doing it rather than anything structural. Sydney always moves hardest in both directions because more of the purchase is borrowed here than anywhere else. The buyers in the strongest position right now are the ones who worked out what they could carry at a higher rate before they started looking.”
Mansour Soltani
Head of Research, OurTop10
Data sources: price and yield figures are from the Cotality Home Value Index, August 2026. National sales volumes, days on market, vendor discounting and auction clearance rates are from Cotality’s monthly housing data to July 2026. The cash rate is the Reserve Bank of Australia target, 4.35% effective 12 August 2026.

MANSOUR SOLTANI
With over two decades of experience in Australia’s real estate sector, Mansour has built a career specialising in the acquisition and sale of investment and commercial properties, spanning major metropolitan hubs and regional areas. As the founder and owner of a finance brokerage firm, he manages a loan portfolio exceeding $250 million while serving a broad range of clients nationwide.
A frequent contributor to money.com.au, Mansour has developed a deep understanding of diverse investment strategies, enabling him to provide valuable, well-informed perspectives on market trends and opportunities.