
Default Loan Report Q3 2026
Postcode-level analysis of mortgage default risk across Australia’s capital cities,
powered by Digital Finance Analytics’ rolling survey of around 4,500 households a month. New this quarter: a separate edition for every state.
National snapshot
Mortgage default risk kept rising across Australia’s capital cities in Q3 2026, but more slowly. Across the 70 ranked default-risk postcodes, the number of households at risk of default rose around +3% in three months on a like-for-like basis, after an 18% jump in Q2 2026, and now stands at roughly 24,546, the highest reading in this series. 42 of 70 ranked postcodes rose over the quarter and 66 of 70 are higher than a year ago; the national total is up +24% in 12 months.
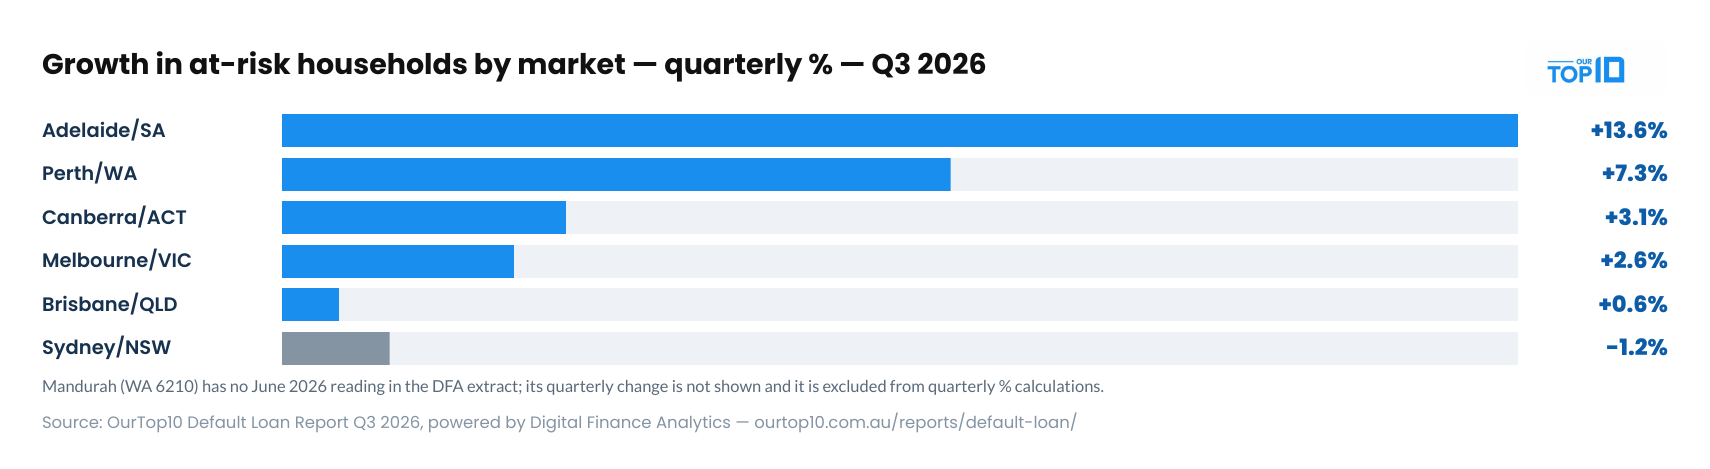
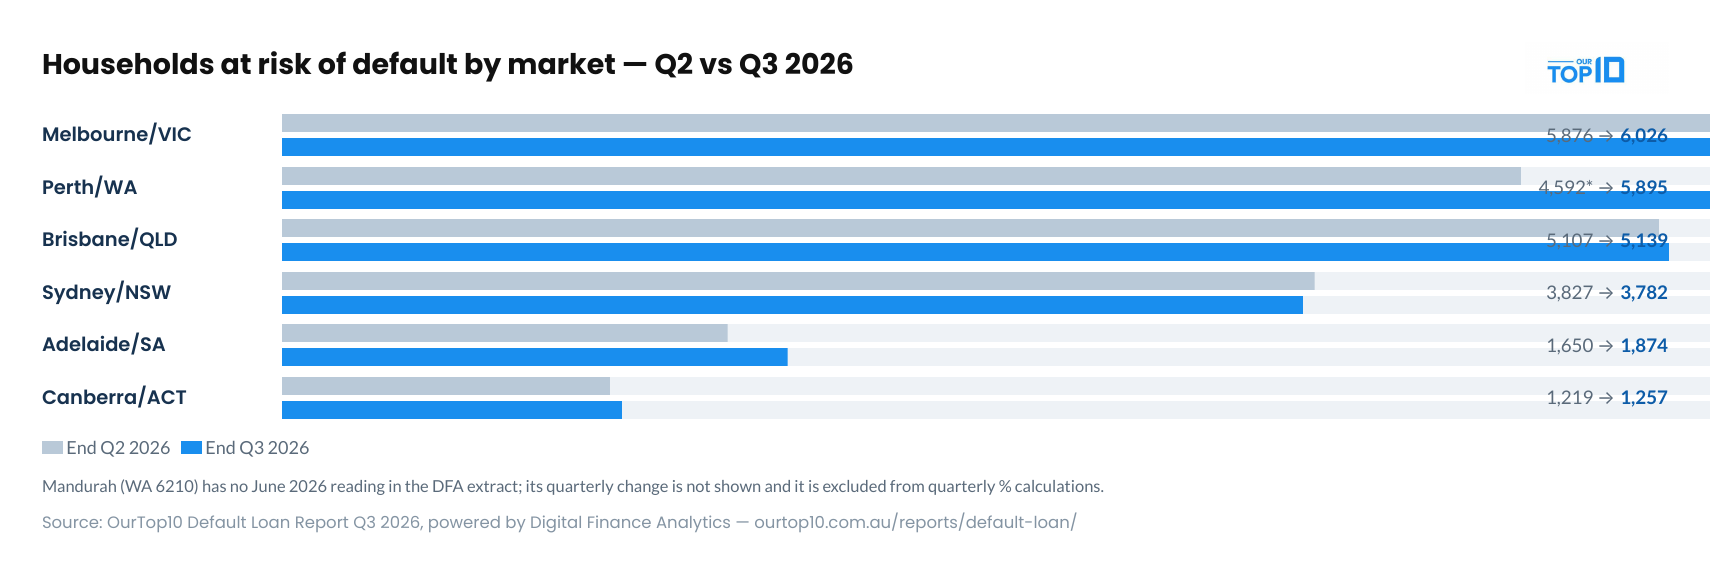
Default risk by market • Q3 2026
| Market | At risk now | 3 mos ago | Qtr change | Annual change | Postcodes up (qtr) |
|---|---|---|---|---|---|
| Adelaide/SA | 1,874 | 1,650 | +13.6% | +31.0% | 7/10 |
| Perth/WA | 5,895 | 4,592* | +7.3% | +26.4% | 7/10 |
| Canberra/ACT | 1,257 | 1,219 | +3.1% | +21.4% | 6/10 |
| Melbourne/VIC | 6,026 | 5,876 | +2.6% | +25.4% | 7/10 |
| Brisbane/QLD | 5,139 | 5,107 | +0.6% | +18.9% | 4/10 |
| Sydney/NSW | 3,782 | 3,827 | -1.2% | +25.3% | 5/10 |
*Perth/WA quarterly change is calculated on the nine postcodes with a June reading; Mandurah (6210, 966 at-risk households) has no June figure in the DFA extract. Northern Territory postcodes are included in national totals but not reported individually. Hobart/TAS is excluded (sample size).
Growth in at-risk households by market — quarterly % — Q3 2026
Households at risk of default — Q2 vs Q3 2026
End Q2 2026 End Q3 2026

“A slower quarter is not a better quarter. Twenty-four thousand households at risk of default is a record for this series, and the pressure is now spreading from the growth corridors into Adelaide and regional Queensland.”

“The slower rise this quarter should not be read as the pressure easing. Default is a lagging measure. The households flagged here have typically been in cash-flow stress for several years, and the growth corridors that led stress in 2021–23 are still where default risk is concentrated. What is new is the breadth. South Australia and the regional centres are now showing the same pattern the growth corridors showed two years ago. Some more affluent households have cash-flow pressures, but they are not at risk of default yet. They have more options and more time to cope. Once defaulted, more than half end up selling in the next couple of years. So stress is a precursor to default, which is a precursor to a forced sale.”
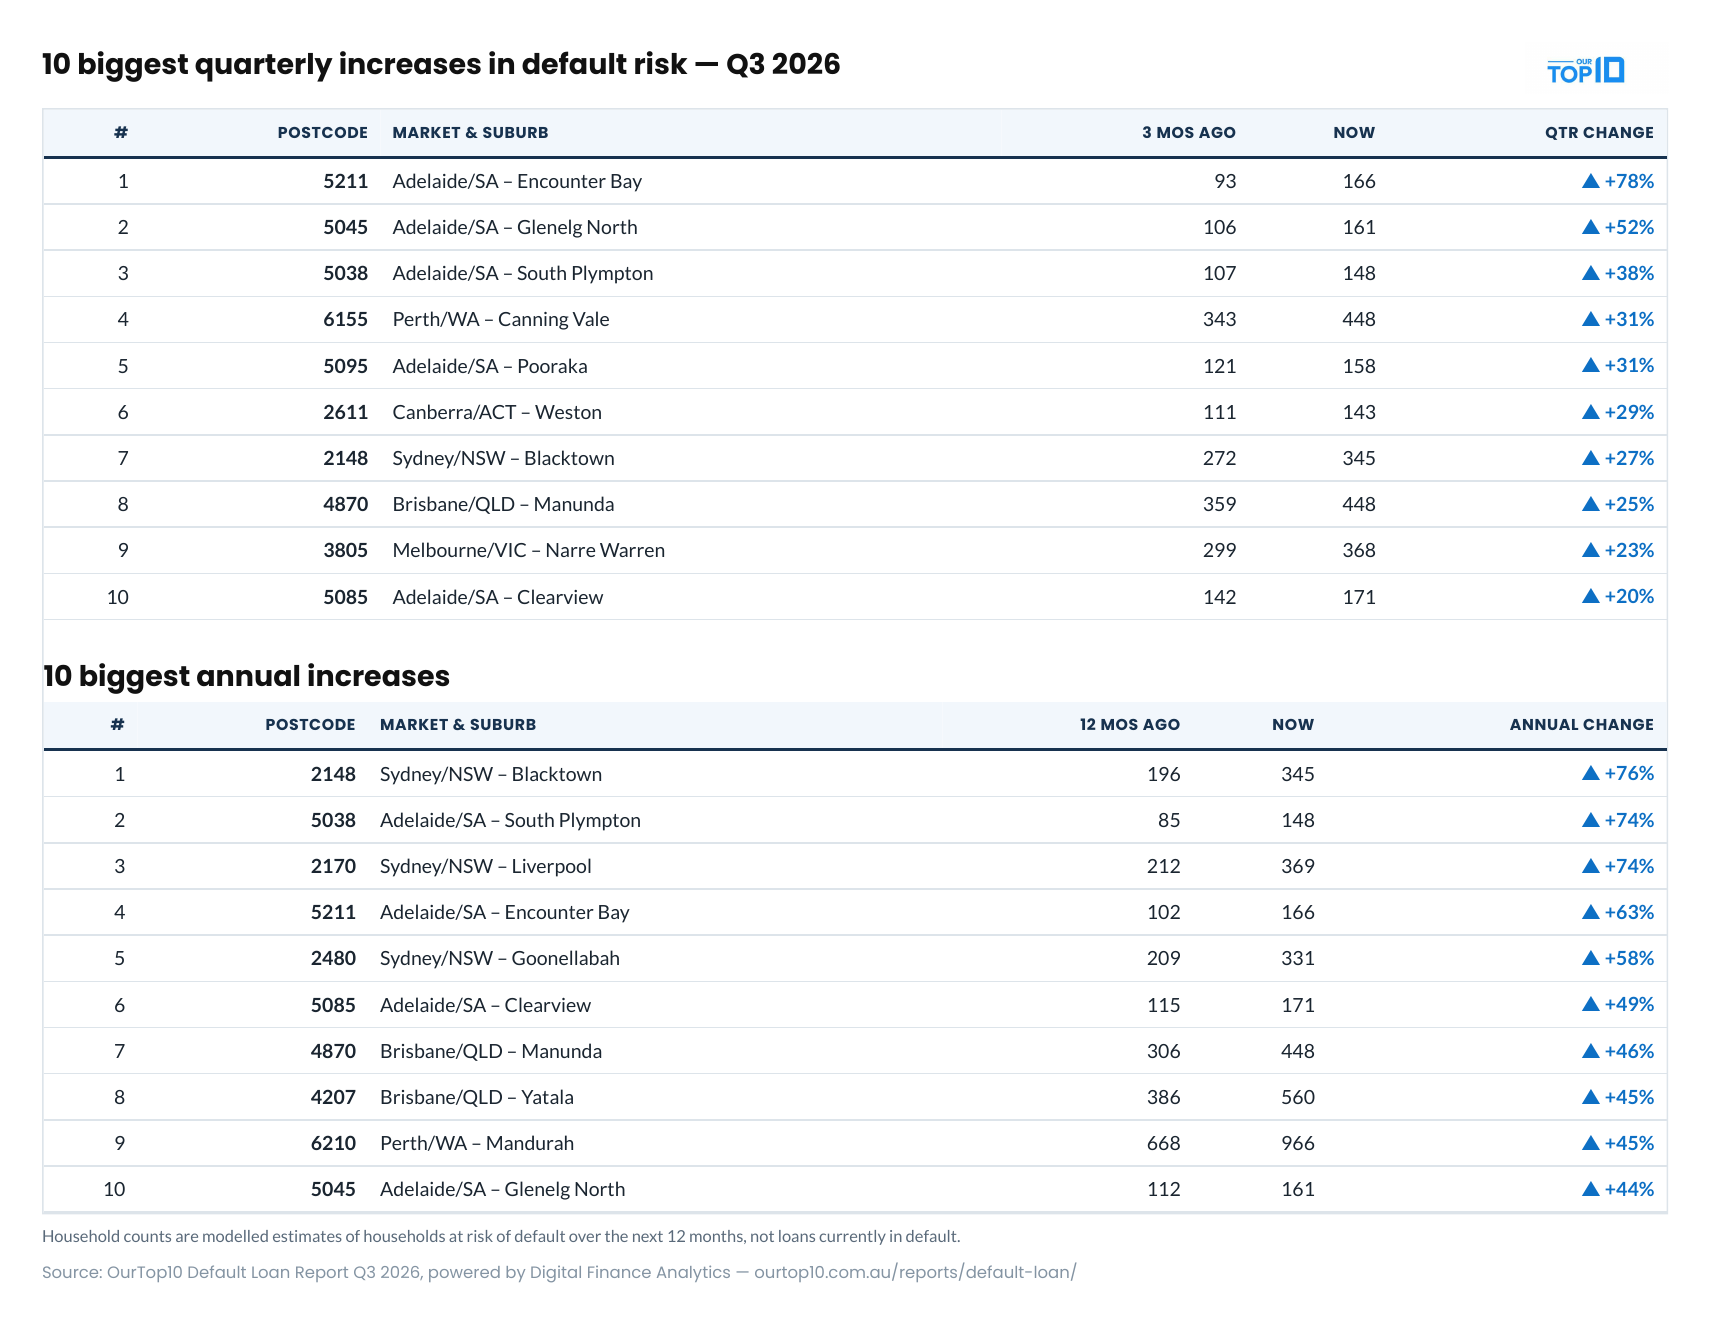
The biggest movers
10 biggest quarterly increases
| # | Postcode | Market & suburb | 3 mos ago | Now | Qtr change |
|---|---|---|---|---|---|
| 1 | 5211 | Adelaide/SA – Encounter Bay | 93 | 166 | ▲ +78% |
| 2 | 5045 | Adelaide/SA – Glenelg North | 106 | 161 | ▲ +52% |
| 3 | 5038 | Adelaide/SA – South Plympton | 107 | 148 | ▲ +38% |
| 4 | 6155 | Perth/WA – Canning Vale | 343 | 448 | ▲ +31% |
| 5 | 5095 | Adelaide/SA – Pooraka | 121 | 158 | ▲ +31% |
| 6 | 2611 | Canberra/ACT – Weston | 111 | 143 | ▲ +29% |
| 7 | 2148 | Sydney/NSW – Blacktown | 272 | 345 | ▲ +27% |
| 8 | 4870 | Brisbane/QLD – Manunda | 359 | 448 | ▲ +25% |
| 9 | 3805 | Melbourne/VIC – Narre Warren | 299 | 368 | ▲ +23% |
| 10 | 5085 | Adelaide/SA – Clearview | 142 | 171 | ▲ +20% |
10 biggest annual increases
| # | Postcode | Market & suburb | 12 mos ago | Now | Annual change |
|---|---|---|---|---|---|
| 1 | 2148 | Sydney/NSW – Blacktown | 196 | 345 | ▲ +76% |
| 2 | 5038 | Adelaide/SA – South Plympton | 85 | 148 | ▲ +74% |
| 3 | 2170 | Sydney/NSW – Liverpool | 212 | 369 | ▲ +74% |
| 4 | 5211 | Adelaide/SA – Encounter Bay | 102 | 166 | ▲ +63% |
| 5 | 2480 | Sydney/NSW – Goonellabah | 209 | 331 | ▲ +58% |
| 6 | 5085 | Adelaide/SA – Clearview | 115 | 171 | ▲ +49% |
| 7 | 4870 | Brisbane/QLD – Manunda | 306 | 448 | ▲ +46% |
| 8 | 4207 | Brisbane/QLD – Yatala | 386 | 560 | ▲ +45% |
| 9 | 6210 | Perth/WA – Mandurah | 668 | 966 | ▲ +45% |
| 10 | 5045 | Adelaide/SA – Glenelg North | 112 | 161 | ▲ +44% |
The 3–5 year lag: from stress to default
Default is not a sudden event. On Digital Finance Analytics’ analysis it takes three to five years on average from sustained cash-flow pressure to default. That lag means today’s default map reflects yesterday’s stress, and today’s stress data shows where defaults emerge next.
The default rankings are still dominated by outer growth-corridor postcodes: Cranbourne, Tarneit, Gosford, Toowoomba, Success. The affluent suburbs leading severe stress do not yet appear. The one crossover, Hornsby (2077), eased -8% in default risk this quarter even as its severe-stress count rose 289%, which is exactly the lag DFA describes: the stress arrives first, the default follows years later. And default is not the end of the chain: on DFA’s numbers, once a household defaults, more than half end up selling within the next couple of years.
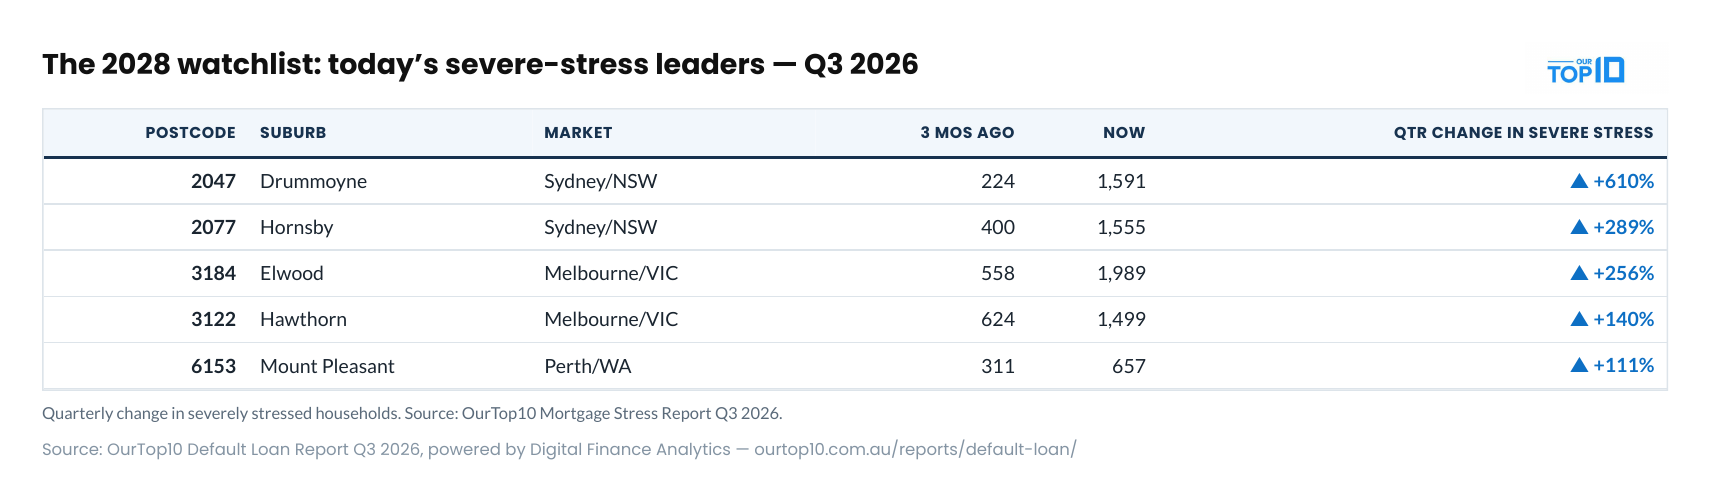
The 2028 watchlist — today’s severe-stress leaders.
- 2047 Drummoyne (Sydney) — severe stress up +610% this quarter (224 → 1,591)
- 2077 Hornsby (Sydney) — severe stress up +289% this quarter (400 → 1,555)
- 3184 Elwood (Melbourne) — severe stress up +256% this quarter (558 → 1,989)
- 3122 Hawthorn (Melbourne) — severe stress up +140% this quarter (624 → 1,499)
- 6153 Mount Pleasant (Perth) — severe stress up +111% this quarter (311 → 657)
Quarterly change in severely stressed households, Q3 2026. Source: OurTop10 Mortgage Stress Report Q3 2026.
Sydney & NSW: top 10 default risk postcodes
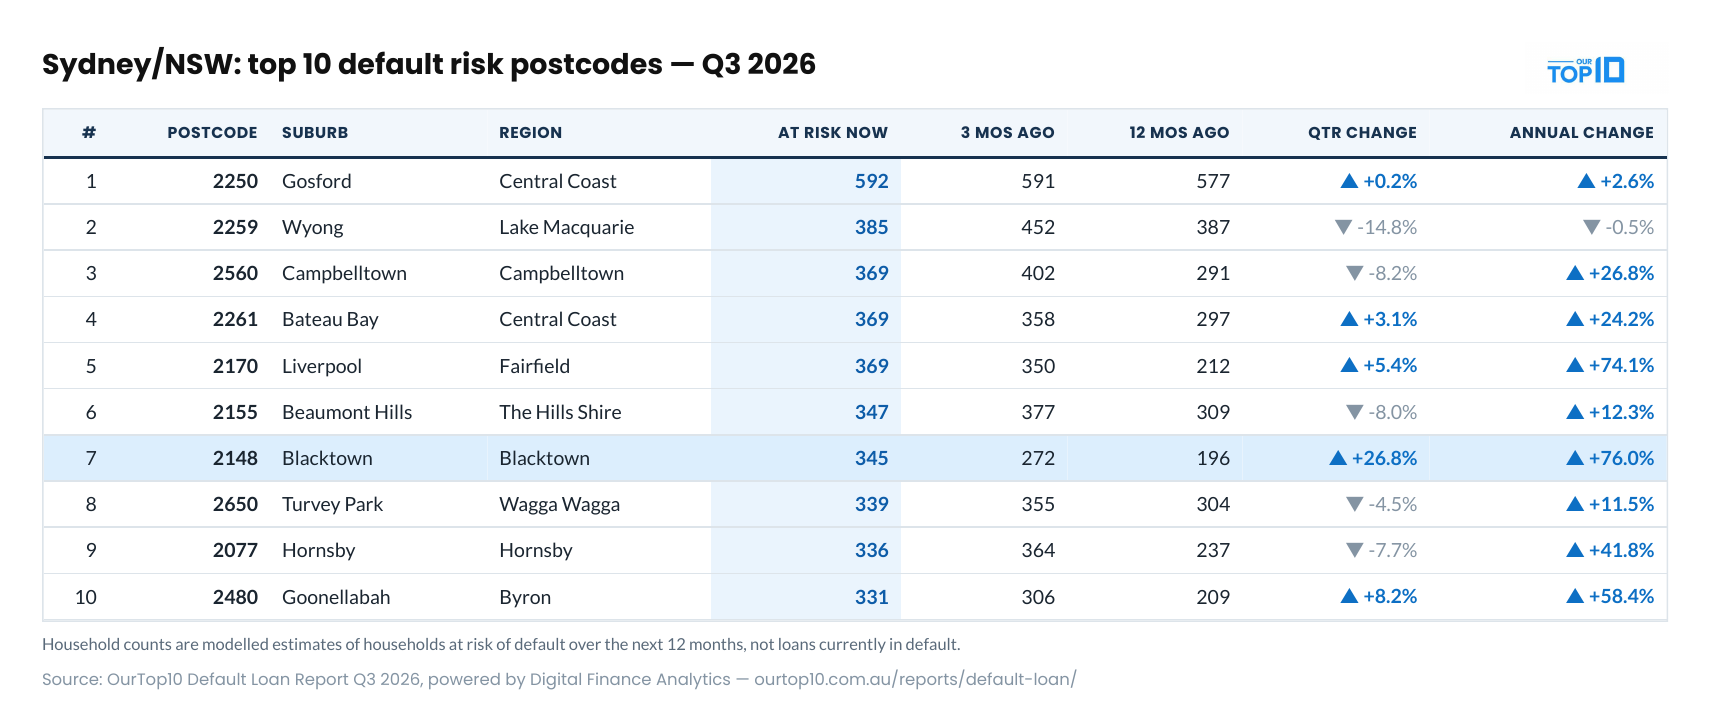
Sydney’s run as the fastest-growing default market has stopped. After rising 24.8% in Q2 2026, at-risk households across the region’s 10 ranked postcodes slipped -1.2% this quarter to 3,782. Only 5 of the 10 rose, and three of its bigger postcodes went backwards: Campbelltown (2560) -8%, Hornsby (2077) -8% and Wyong (2259) -15%.
The year-on-year picture is less comfortable. The region is still up +25.3% on a year ago, and the western suburbs are now the pressure point: Blacktown (2148) rose +27% in the quarter and +76% over the year, from 196 to 345 at-risk households, and Liverpool (2170) is up +74% for the year.
Gosford (2250) holds the state’s largest count at 592, essentially flat on the quarter. Hornsby, flagged last quarter as the first affluent postcode to appear in the default rankings, eased -8% but is still +42% higher than a year ago. If you are under pressure in Sydney, an experienced local mortgage broker can help you review your loan.
Top 10 Sydney & NSW postcodes – ranked by default risk • Q3 2026
| # | Postcode | Suburb | Region | At risk now | 3 mos ago | 12 mos ago | Qtr change | Annual change |
|---|---|---|---|---|---|---|---|---|
| 1 | 2250 | Gosford | Central Coast | 592 | 591 | 577 | ▲ +0.2% | ▲ +2.6% |
| 2 | 2259 | Wyong | Lake Macquarie | 385 | 452 | 387 | ▼ -14.8% | ▼ -0.5% |
| 3 | 2560 | Campbelltown | Campbelltown | 369 | 402 | 291 | ▼ -8.2% | ▲ +26.8% |
| 4 | 2261 | Bateau Bay | Central Coast | 369 | 358 | 297 | ▲ +3.1% | ▲ +24.2% |
| 5 | 2170 | Liverpool | Fairfield | 369 | 350 | 212 | ▲ +5.4% | ▲ +74.1% |
| 6 | 2155 | Beaumont Hills | The Hills Shire | 347 | 377 | 309 | ▼ -8.0% | ▲ +12.3% |
| 7 | 2148 | Blacktown | Blacktown | 345 | 272 | 196 | ▲ +26.8% | ▲ +76.0% |
| 8 | 2650 | Turvey Park | Wagga Wagga | 339 | 355 | 304 | ▼ -4.5% | ▲ +11.5% |
| 9 | 2077 | Hornsby | Hornsby | 336 | 364 | 237 | ▼ -7.7% | ▲ +41.8% |
| 10 | 2480 | Goonellabah | Byron | 331 | 306 | 209 | ▲ +8.2% | ▲ +58.4% |
Household counts are modelled estimates of households at risk of default over the next 12 months. Movements off small bases can be volatile quarter to quarter.
Melbourne & VIC: top 10 default risk postcodes
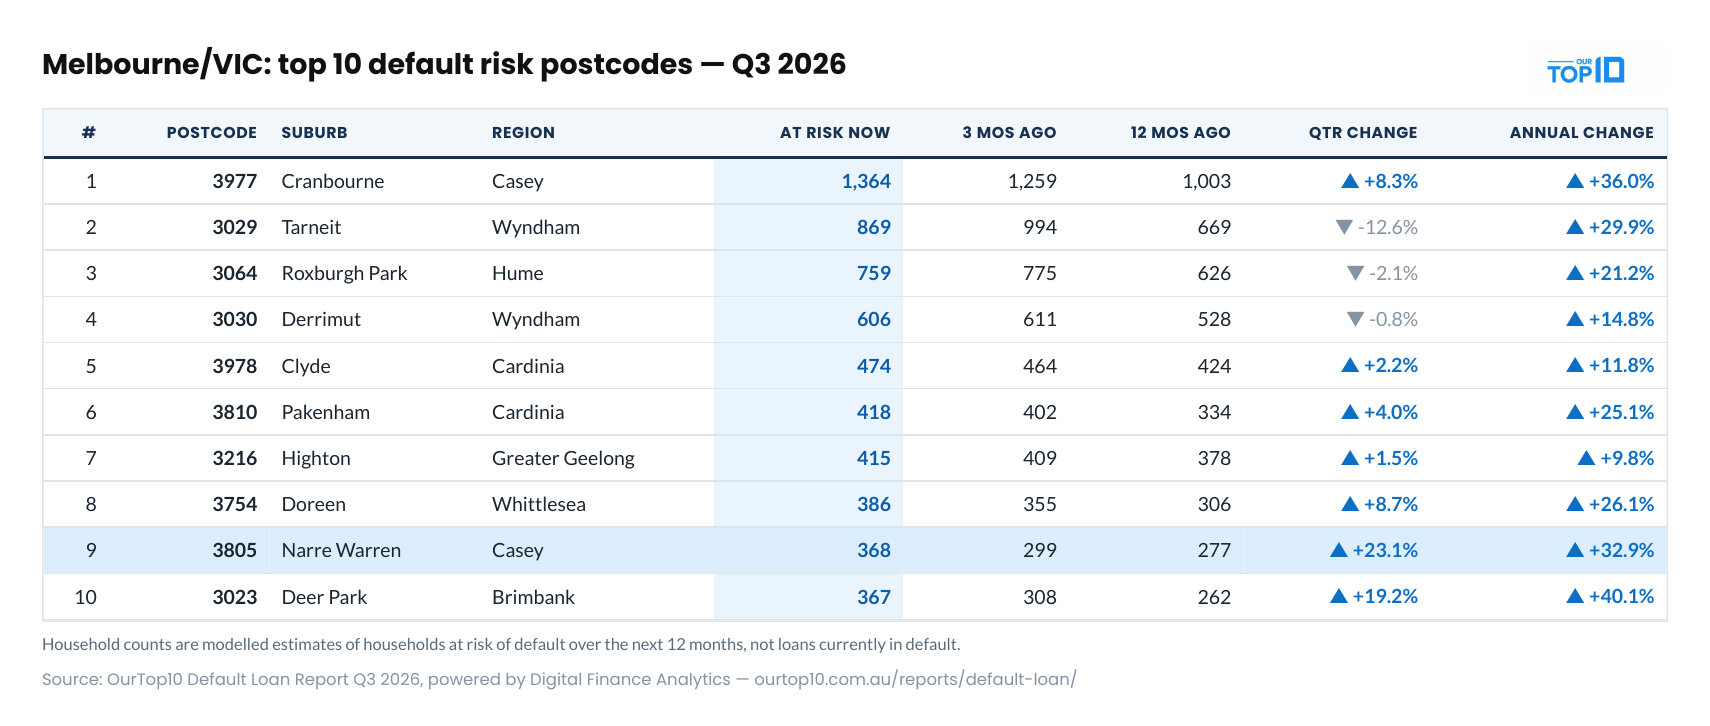
Melbourne and surrounding regions remain the largest default-risk market in the country, with 6,026 at-risk households across the 10 ranked postcodes, up +2.6% for the quarter and +25.4% for the year. 7 of the 10 rose.
Cranbourne (3977) is still the single largest default-risk hotspot in Australia at 1,364 at-risk households, up +8% in three months and +36% on a year ago. The sharpest quarterly rises were Narre Warren (3805) at +23% and Deer Park (3023) at +19%, both in the south-east and west growth corridors.
Two of last quarter’s big risers have cooled. Tarneit (3029) fell -13% to 869, and Ferntree Gully (3156), which jumped 166% in Q2 2026, has dropped out of the top 10 altogether. Movements like these are consistent with DFA’s view that defaults sometimes self-cure, but Melbourne’s list is still +25.4% higher than a year ago. If you are under pressure in Melbourne, an experienced local mortgage broker can help you review your loan.
Top 10 Melbourne & VIC postcodes – ranked by default risk • Q3 2026
| # | Postcode | Suburb | Region | At risk now | 3 mos ago | 12 mos ago | Qtr change | Annual change |
|---|---|---|---|---|---|---|---|---|
| 1 | 3977 | Cranbourne | Casey | 1,364 | 1,259 | 1,003 | ▲ +8.3% | ▲ +36.0% |
| 2 | 3029 | Tarneit | Wyndham | 869 | 994 | 669 | ▼ -12.6% | ▲ +29.9% |
| 3 | 3064 | Roxburgh Park | Hume | 759 | 775 | 626 | ▼ -2.1% | ▲ +21.2% |
| 4 | 3030 | Derrimut | Wyndham | 606 | 611 | 528 | ▼ -0.8% | ▲ +14.8% |
| 5 | 3978 | Clyde | Cardinia | 474 | 464 | 424 | ▲ +2.2% | ▲ +11.8% |
| 6 | 3810 | Pakenham | Cardinia | 418 | 402 | 334 | ▲ +4.0% | ▲ +25.1% |
| 7 | 3216 | Highton | Greater Geelong | 415 | 409 | 378 | ▲ +1.5% | ▲ +9.8% |
| 8 | 3754 | Doreen | Whittlesea | 386 | 355 | 306 | ▲ +8.7% | ▲ +26.1% |
| 9 | 3805 | Narre Warren | Casey | 368 | 299 | 277 | ▲ +23.1% | ▲ +32.9% |
| 10 | 3023 | Deer Park | Brimbank | 367 | 308 | 262 | ▲ +19.2% | ▲ +40.1% |
Household counts are modelled estimates of households at risk of default over the next 12 months. Movements off small bases can be volatile quarter to quarter.
Brisbane & QLD: top 10 default risk postcodes
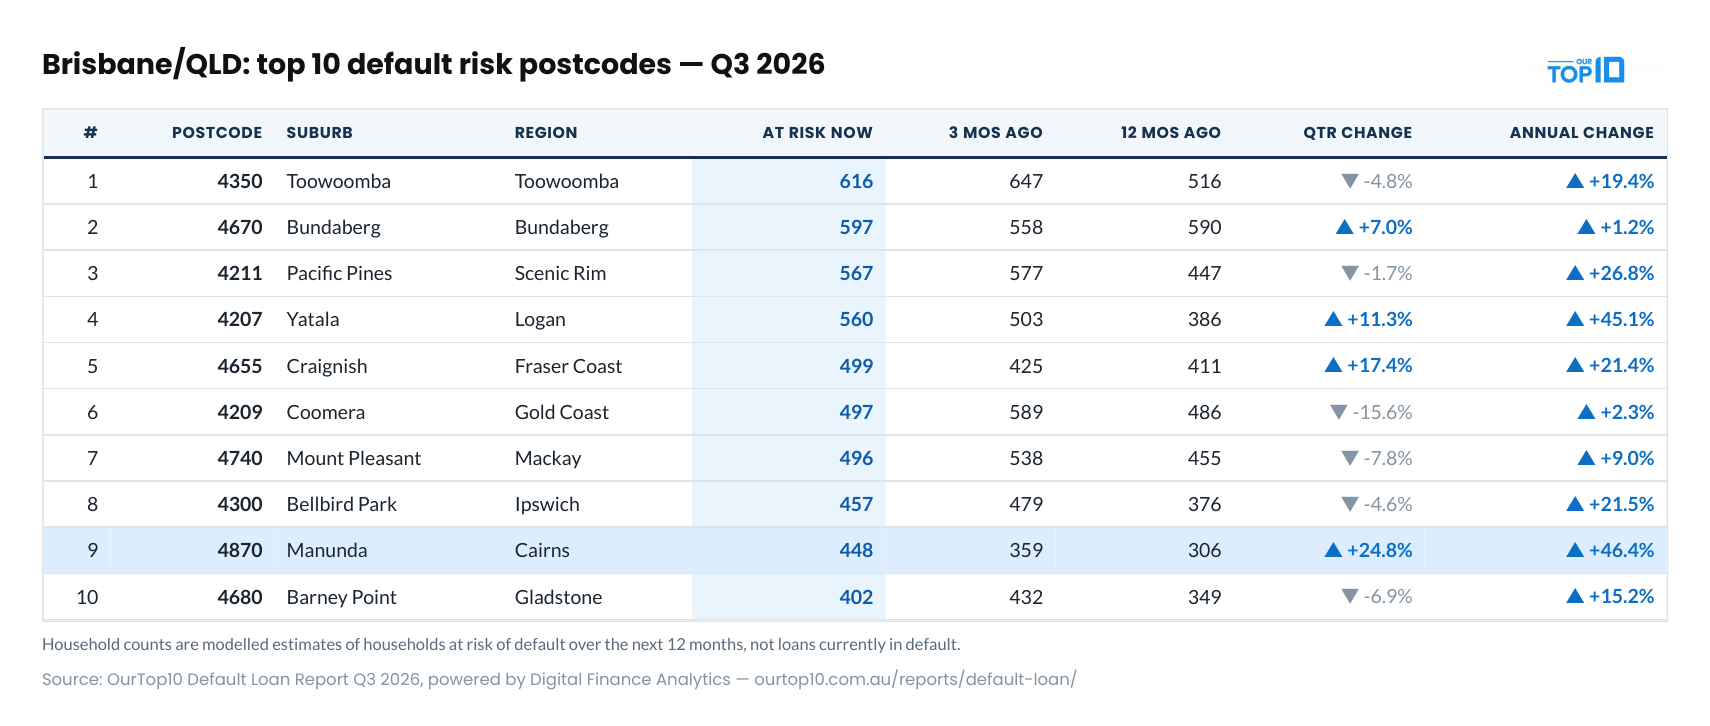
Queensland is flat. At-risk households across the state’s 10 ranked postcodes rose just +0.6% this quarter to 5,139, the smallest rise of any market, with only 4 of the 10 rising. The annual figure, +18.9%, shows the pressure built earlier in the year has not unwound.
Regional Queensland is where the movement is. Manunda in Cairns (4870), the postcode with the country’s sharpest rise in mortgage stress this quarter, also recorded the state’s largest increase in default risk, up +25% to 448. Craignish on the Fraser Coast (4655) rose +17% and Yatala in Logan (4207) +11%.
Toowoomba (4350) still carries the state’s biggest count at 616, down -5% on the quarter. Coomera on the Gold Coast (4209) recorded the largest fall, -16%, and Bundaberg (4670), up +7% for the quarter, is essentially unchanged on a year ago (+1%). If you are under pressure in Brisbane, an experienced local mortgage broker can help you review your loan.
Top 10 Brisbane & QLD postcodes – ranked by default risk • Q3 2026
| # | Postcode | Suburb | Region | At risk now | 3 mos ago | 12 mos ago | Qtr change | Annual change |
|---|---|---|---|---|---|---|---|---|
| 1 | 4350 | Toowoomba | Toowoomba | 616 | 647 | 516 | ▼ -4.8% | ▲ +19.4% |
| 2 | 4670 | Bundaberg | Bundaberg | 597 | 558 | 590 | ▲ +7.0% | ▲ +1.2% |
| 3 | 4211 | Pacific Pines | Scenic Rim | 567 | 577 | 447 | ▼ -1.7% | ▲ +26.8% |
| 4 | 4207 | Yatala | Logan | 560 | 503 | 386 | ▲ +11.3% | ▲ +45.1% |
| 5 | 4655 | Craignish | Fraser Coast | 499 | 425 | 411 | ▲ +17.4% | ▲ +21.4% |
| 6 | 4209 | Coomera | Gold Coast | 497 | 589 | 486 | ▼ -15.6% | ▲ +2.3% |
| 7 | 4740 | Mount Pleasant | Mackay | 496 | 538 | 455 | ▼ -7.8% | ▲ +9.0% |
| 8 | 4300 | Bellbird Park | Ipswich | 457 | 479 | 376 | ▼ -4.6% | ▲ +21.5% |
| 9 | 4870 | Manunda | Cairns | 448 | 359 | 306 | ▲ +24.8% | ▲ +46.4% |
| 10 | 4680 | Barney Point | Gladstone | 402 | 432 | 349 | ▼ -6.9% | ▲ +15.2% |
Household counts are modelled estimates of households at risk of default over the next 12 months. Movements off small bases can be volatile quarter to quarter.
Perth & WA: top 10 default risk postcodes
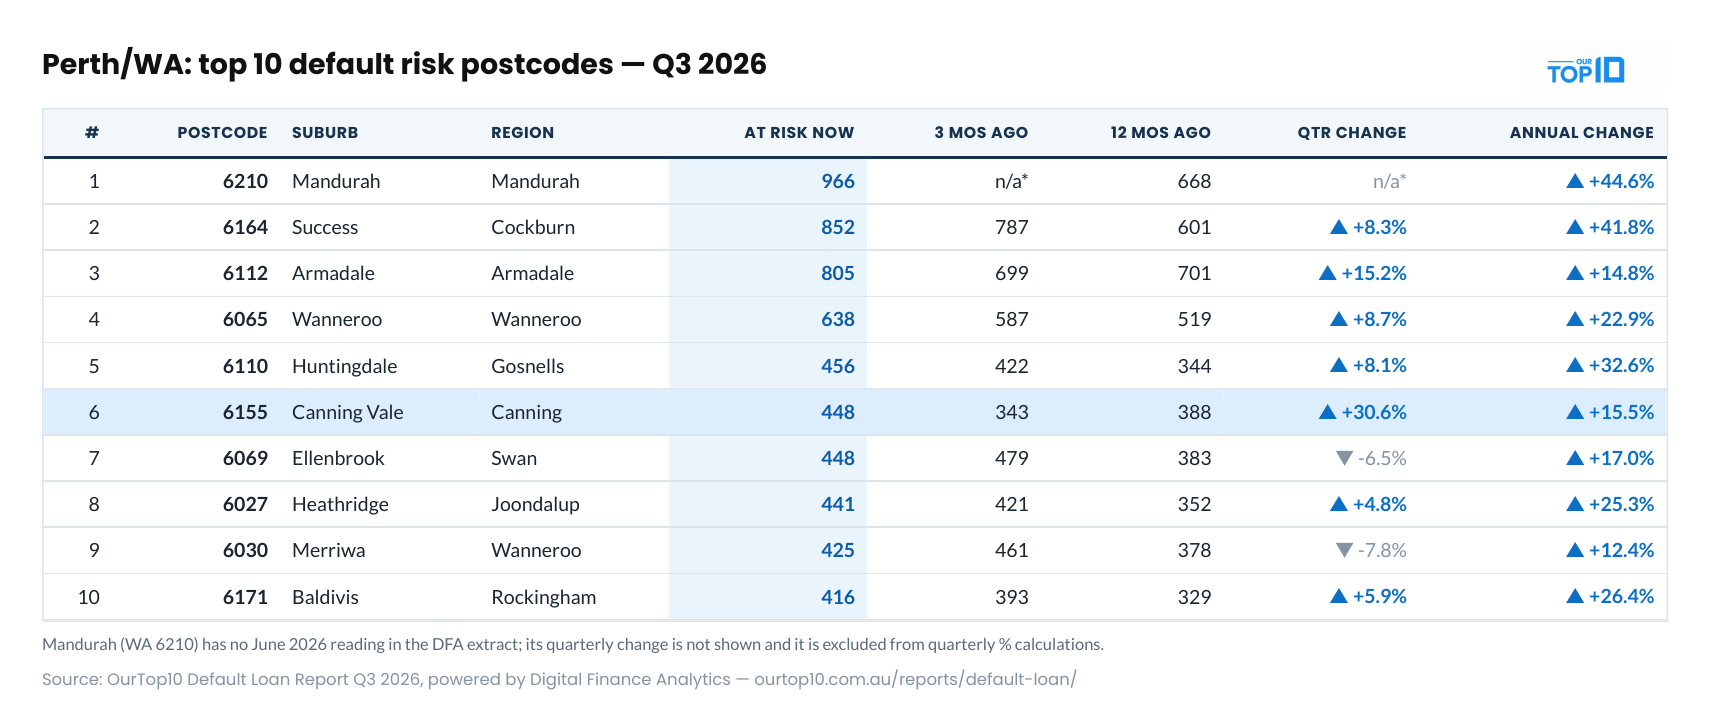
Western Australia has the biggest volume jump in the country, though it comes with a caveat. Mandurah (6210) tops the rankings at 966 at-risk households, the largest count in WA and the second-largest nationally, but DFA’s extract carries no June reading for the postcode, so its quarterly change cannot be calculated.
On the nine postcodes with a prior reading, at-risk households rose +7.3% for the quarter. 7 of the 10 ranked postcodes rose. Canning Vale (6155) recorded the west’s sharpest quarterly rise at +31%, and Armadale (6112) rose +15% to 805.
By volume, Success (6164) at 852, Armadale at 805 and Wanneroo (6065) at 638 follow Mandurah. Every one of WA’s 10 ranked postcodes is higher than a year ago, with the state up +26.4% on 12 months earlier.
Top 10 Perth & WA postcodes – ranked by default risk • Q3 2026
| # | Postcode | Suburb | Region | At risk now | 3 mos ago | 12 mos ago | Qtr change | Annual change |
|---|---|---|---|---|---|---|---|---|
| 1 | 6210 | Mandurah | Mandurah | 966 | n/a* | 668 | n/a* | ▲ +44.6% |
| 2 | 6164 | Success | Cockburn | 852 | 787 | 601 | ▲ +8.3% | ▲ +41.8% |
| 3 | 6112 | Armadale | Armadale | 805 | 699 | 701 | ▲ +15.2% | ▲ +14.8% |
| 4 | 6065 | Wanneroo | Wanneroo | 638 | 587 | 519 | ▲ +8.7% | ▲ +22.9% |
| 5 | 6110 | Huntingdale | Gosnells | 456 | 422 | 344 | ▲ +8.1% | ▲ +32.6% |
| 6 | 6155 | Canning Vale | Canning | 448 | 343 | 388 | ▲ +30.6% | ▲ +15.5% |
| 7 | 6069 | Ellenbrook | Swan | 448 | 479 | 383 | ▼ -6.5% | ▲ +17.0% |
| 8 | 6027 | Heathridge | Joondalup | 441 | 421 | 352 | ▲ +4.8% | ▲ +25.3% |
| 9 | 6030 | Merriwa | Wanneroo | 425 | 461 | 378 | ▼ -7.8% | ▲ +12.4% |
| 10 | 6171 | Baldivis | Rockingham | 416 | 393 | 329 | ▲ +5.9% | ▲ +26.4% |
Household counts are modelled estimates of households at risk of default over the next 12 months. Movements off small bases can be volatile quarter to quarter. *Mandurah (6210): no June 2026 reading was supplied in the DFA extract, so its quarterly change is not shown and it is excluded from quarterly % calculations.
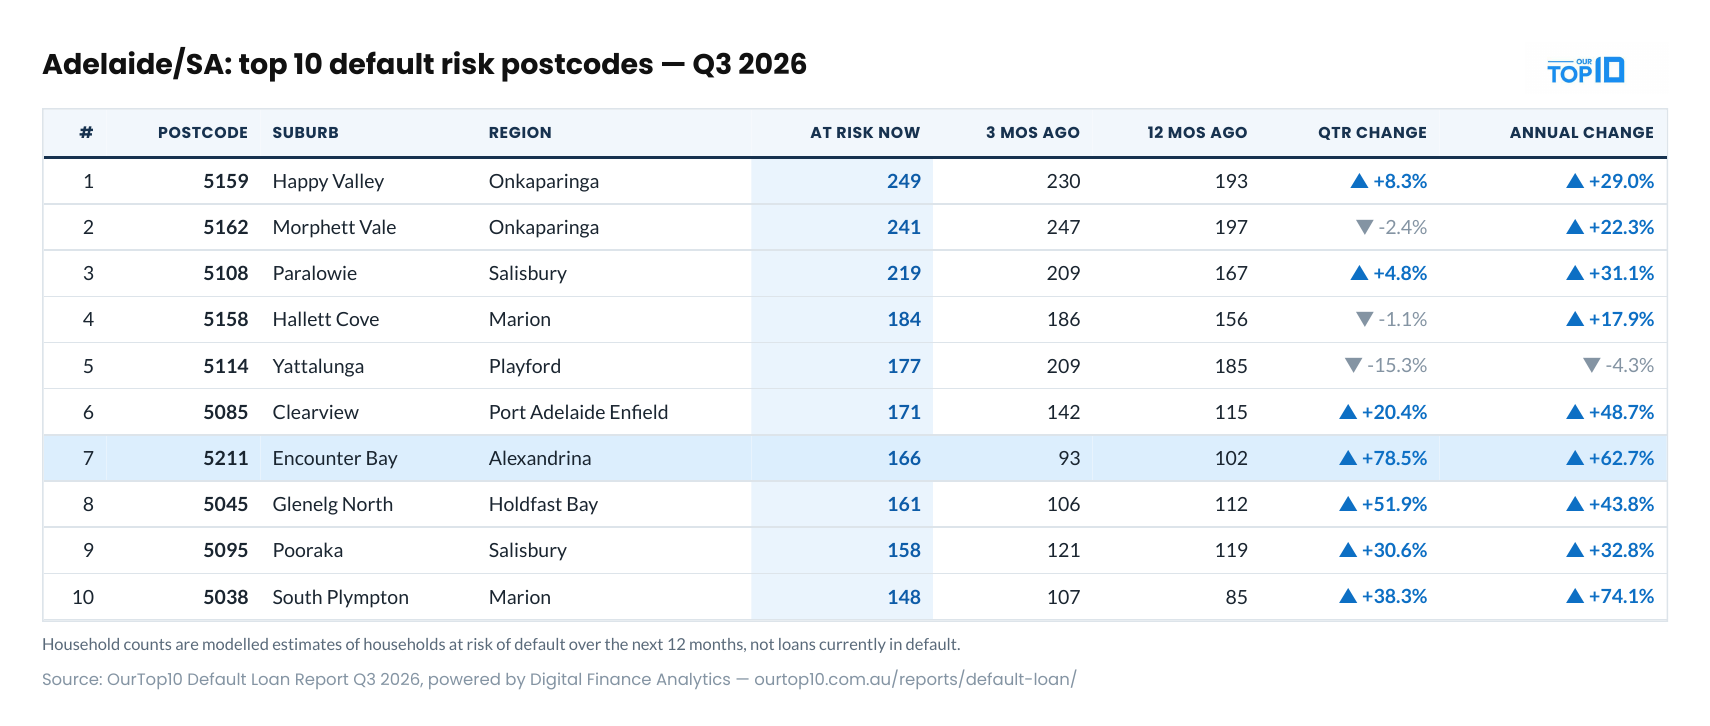
Adelaide & SA: top 10 default risk postcodes
Adelaide is this quarter’s fastest-growing default market. At-risk households across the city’s 10 ranked postcodes rose +13.6% in three months to 1,874, and +31.0% over the year, the strongest annual rate of any market. 7 of the 10 rose.
Encounter Bay (5211) on the Fleurieu Peninsula recorded the sharpest quarterly rise anywhere in Australia, up +78% from 93 to 166. Glenelg North (5045) was next at +52%, then South Plympton (5038) at +38% and Pooraka (5095) at +31%.
Adelaide’s base is small, so individual postcodes can swing, but seven of 10 moving the same way in one quarter is not noise. Happy Valley (5159) holds the city’s largest count at 249. Yattalunga (5114) is the one ranked postcode lower than a year ago.
Top 10 Adelaide & SA postcodes – ranked by default risk • Q3 2026
| # | Postcode | Suburb | Region | At risk now | 3 mos ago | 12 mos ago | Qtr change | Annual change |
|---|---|---|---|---|---|---|---|---|
| 1 | 5159 | Happy Valley | Onkaparinga | 249 | 230 | 193 | ▲ +8.3% | ▲ +29.0% |
| 2 | 5162 | Morphett Vale | Onkaparinga | 241 | 247 | 197 | ▼ -2.4% | ▲ +22.3% |
| 3 | 5108 | Paralowie | Salisbury | 219 | 209 | 167 | ▲ +4.8% | ▲ +31.1% |
| 4 | 5158 | Hallett Cove | Marion | 184 | 186 | 156 | ▼ -1.1% | ▲ +17.9% |
| 5 | 5114 | Yattalunga | Playford | 177 | 209 | 185 | ▼ -15.3% | ▼ -4.3% |
| 6 | 5085 | Clearview | Port Adelaide Enfield | 171 | 142 | 115 | ▲ +20.4% | ▲ +48.7% |
| 7 | 5211 | Encounter Bay | Alexandrina | 166 | 93 | 102 | ▲ +78.5% | ▲ +62.7% |
| 8 | 5045 | Glenelg North | Holdfast Bay | 161 | 106 | 112 | ▲ +51.9% | ▲ +43.8% |
| 9 | 5095 | Pooraka | Salisbury | 158 | 121 | 119 | ▲ +30.6% | ▲ +32.8% |
| 10 | 5038 | South Plympton | Marion | 148 | 107 | 85 | ▲ +38.3% | ▲ +74.1% |
Household counts are modelled estimates of households at risk of default over the next 12 months. Movements off small bases can be volatile quarter to quarter.
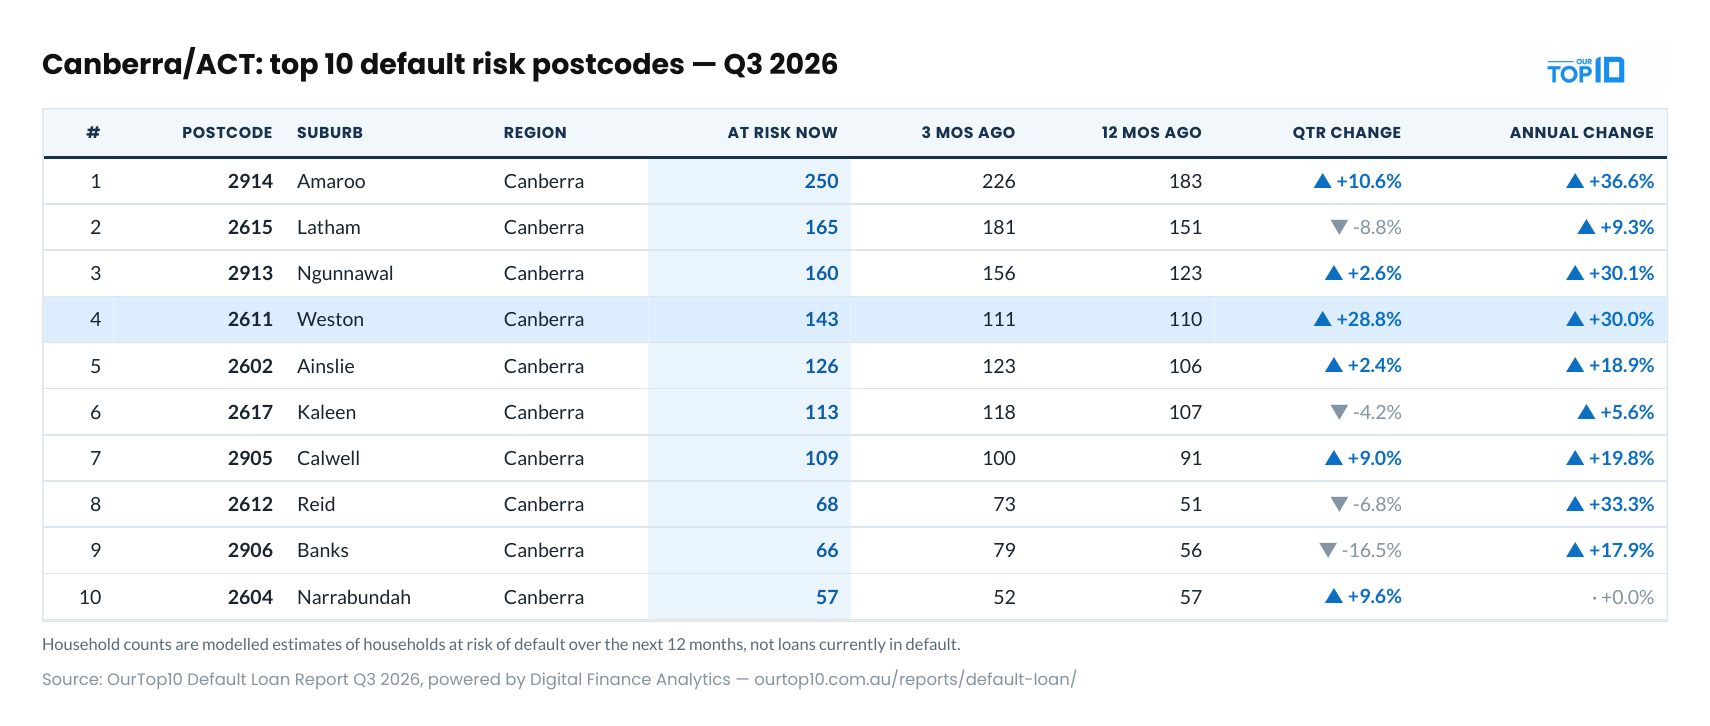
Canberra & ACT: top 10 default risk postcodes
Canberra’s default-risk base is small, 1,257 at-risk households across its 10 ranked postcodes, and its growth has slowed to +3.1% this quarter. It is still +21.4% higher than a year ago, with 6 of 10 postcodes rising over the quarter.
Weston (2611) recorded the territory’s sharpest quarterly rise at +29%, from 111 to 143. Amaroo (2914) in Gungahlin carries the ACT’s largest count at 250, up +11% for the quarter and +37% for the year.
Last quarter’s fast risers have eased: Kaleen (2617) and Banks (2906) both fell over the quarter. Canberra’s story remains one of speed off a small base rather than scale.
Top 10 Canberra & ACT postcodes – ranked by default risk • Q3 2026
| # | Postcode | Suburb | Region | At risk now | 3 mos ago | 12 mos ago | Qtr change | Annual change |
|---|---|---|---|---|---|---|---|---|
| 1 | 2914 | Amaroo | Canberra | 250 | 226 | 183 | ▲ +10.6% | ▲ +36.6% |
| 2 | 2615 | Latham | Canberra | 165 | 181 | 151 | ▼ -8.8% | ▲ +9.3% |
| 3 | 2913 | Ngunnawal | Canberra | 160 | 156 | 123 | ▲ +2.6% | ▲ +30.1% |
| 4 | 2611 | Weston | Canberra | 143 | 111 | 110 | ▲ +28.8% | ▲ +30.0% |
| 5 | 2602 | Ainslie | Canberra | 126 | 123 | 106 | ▲ +2.4% | ▲ +18.9% |
| 6 | 2617 | Kaleen | Canberra | 113 | 118 | 107 | ▼ -4.2% | ▲ +5.6% |
| 7 | 2905 | Calwell | Canberra | 109 | 100 | 91 | ▲ +9.0% | ▲ +19.8% |
| 8 | 2612 | Reid | Canberra | 68 | 73 | 51 | ▼ -6.8% | ▲ +33.3% |
| 9 | 2906 | Banks | Canberra | 66 | 79 | 56 | ▼ -16.5% | ▲ +17.9% |
| 10 | 2604 | Narrabundah | Canberra | 57 | 52 | 57 | ▲ +9.6% | · +0.0% |
Household counts are modelled estimates of households at risk of default over the next 12 months. Movements off small bases can be volatile quarter to quarter.
Methodology
The data behind this report comes from research carried out by Digital Finance Analytics (DFA), drawn from the same rolling survey program that powers the OurTop10 Mortgage Stress Report: around 4,500 households surveyed each month, scaled to reflect Australia’s roughly 10 million households and benchmarked against Census data and RBA lending exposure figures.
A default is a missed payment which flags the loan with the lender as out of order. Sometimes these self-cure; often they are an indicator of trouble ahead. DFA’s default estimate is a projection that combines the history of loans over more than 25 years with current and future household cash-flow stress, expressed as the number (and percentage) of borrowers estimated to be at risk of default over the next 12 months. Counts are modelled estimates, not loans currently in default or arrears figures reported by lenders.
Because default is a lagging outcome, on average three to five years from sustained cash-flow pressure, default risk moves more slowly than mortgage stress and is the more forward-looking of DFA’s severity measures. The analysis is done at a postcode level, not suburb; Hobart/TAS is excluded for sample-size reasons and Northern Territory postcodes are counted in national totals but not reported individually. Suburb and LGA pairings are representative localities derived from around 28,000 ABS statistical zones.
Quarterly and annual percentage changes for each market and for the national total are calculated on a like-for-like basis: only postcodes with a reading in the comparison period are included. Mandurah (WA 6210) has no June 2026 reading and is excluded from the quarterly percentage, though its 966 at-risk households are included in the current totals.
FAQs
What counts as a mortgage default in this data?
A default is a missed payment that flags the loan with the lender as out of order. Sometimes these self-cure; often they are an indicator of trouble ahead. DFA estimates the likelihood of default over the next 12 months — counts are modelled estimates of households at risk, not loans currently in default or lender arrears figures.
Is the data based on actual household data, modelling, or both?
Both. DFA’s default estimate combines more than 25 years of loan history with current and future household cash-flow stress, drawn from the same rolling survey program that powers the OurTop10 Mortgage Stress Report: around 4,500 households surveyed each month, scaled to Australia’s roughly 10 million households and benchmarked against Census data and RBA lending exposure figures.
How does default risk relate to mortgage stress?
Stress measures who is under cash-flow pressure now; default risk measures who may not make it through the cycle. On DFA’s analysis it takes three to five years on average from sustained cash-flow pressure to default, and once a household defaults, more than half end up selling within the next couple of years: stress is a precursor to default, which is a precursor to a forced sale.
Why did the national figure rise more slowly this quarter?
The growth corridors that dominated the rankings in Q2 2026 mostly held steady or eased in Q3, while new pressure showed up in Adelaide, regional Queensland and Sydney’s west. The like-for-like national rise was about 3% against 18% last quarter, but 66 of the 70 ranked postcodes are still higher than a year ago.
Why is Hobart excluded, and why is the Northern Territory not reported individually?
Sample sizes in Tasmania are too small for reliable default estimates at postcode level, so Hobart/TAS is excluded. Northern Territory postcodes are included in the national totals but, because their household counts are very small, they are not reported individually.
How reliable is the data at postcode versus suburb level?
The analysis is done at postcode level because it provides a statistically more reliable sample size. Suburb and LGA pairings are representative localities; DFA’s geographic mapping is derived from detailed ABS statistical zones (around 28,000 nationally), which split across adjacent postcodes.
Use our charts & data
Every table and chart below can be republished with attribution to “the OurTop10 Default Loan Report, powered by Digital Finance Analytics” and a link to this page.
Full dataset
All markets (XLSX)All markets (CSV)Market summary (CSV)Biggest movers (CSV)2028 watchlist (CSV)
City tables & data
Sydney & NSW table (PNG)Sydney & NSW (CSV) Melbourne & VIC table (PNG)Melbourne & VIC (CSV) Brisbane & QLD table (PNG)Brisbane & QLD (CSV) Perth & WA table (PNG)Perth & WA (CSV) Adelaide & SA table (PNG)Adelaide & SA (CSV) Canberra & ACT table (PNG)Canberra & ACT (CSV)
Biggest movers table (PNG)2028 watchlist table (PNG)
National charts
Growth in at-risk households by market – quarterly %
Embed code (copy and paste into your article; the source link is included):
<figure><a href="https://ourtop10.com.au/reports/default-loan/"><img src="https://ourtop10.com.au/wp-content/uploads/ourtop10-chart-default-growth-by-market-q3-2026.png" alt="Growth in at-risk households by market – quarterly % - OurTop10 Default Loan Report Q3 2026" width="1140" style="max-width:100%;height:auto"></a><figcaption>Source: <a href="https://ourtop10.com.au/reports/default-loan/">OurTop10 Default Loan Report Q3 2026</a>, powered by Digital Finance Analytics</figcaption></figure>Households at risk of default by market – Q2 vs Q3 2026
Embed code (copy and paste into your article; the source link is included):
<figure><a href="https://ourtop10.com.au/reports/default-loan/"><img src="https://ourtop10.com.au/wp-content/uploads/ourtop10-chart-default-at-risk-q2-vs-q3-2026.png" alt="Households at risk of default by market – Q2 vs Q3 2026 - OurTop10 Default Loan Report Q3 2026" width="1140" style="max-width:100%;height:auto"></a><figcaption>Source: <a href="https://ourtop10.com.au/reports/default-loan/">OurTop10 Default Loan Report Q3 2026</a>, powered by Digital Finance Analytics</figcaption></figure>About OurTop10
OurTop10 is an Australian comparison and research platform dedicated to helping consumers identify leading mortgage brokers, accountants, conveyancers and buyer’s agents across Australia’s major cities. In addition to comparison services, OurTop10 delivers market research, property insights and industry news. The Default Loan Report is published quarterly alongside the OurTop10 Mortgage Stress Report.
Downloads & media
All data in this report was produced by Digital Finance Analytics and is reproduced with permission. When reporting on these findings, please attribute to “the OurTop10 Default Loan Report, powered by Digital Finance Analytics” and link to this page.
The report
State and territory editions
Data & charts
The numbers behind every table, plus ready-to-use charts. Want just one chart or table? Grab them one by one here.
Previous releases: Q2 2026
Media contact: Mansour Soltani, Head of Research, OurTop10 · 0405 500 981 · [email protected]
Where this report has been covered
Journalists and editors who have reported on this release. Charts, tables and postcode-level data can be republished with attribution to OurTop10 and Digital Finance Analytics. To be pre-briefed before the next quarterly release, email [email protected].
9 News Australia — Record number of homeowners reach mortgage tipping point