

Default Loan Report Q2 2026
Postcode-level analysis of mortgage default risk across Australia’s capital cities,
powered by Digital Finance Analytics’ modelling of households at risk of default.
National snapshot
Mortgage default risk accelerated across Australia’s capital cities in Q2 2026. The number of households at risk of default across the 70 ranked postcodes rose around 18% in three months — the sharpest quarterly increase since this data series began.
The OurTop10 Default Loan Report, powered by Digital Finance Analytics, ranks the top 10 postcodes in and around Australia’s major capital cities by mortgage default risk, tracking how those figures have changed over the past quarter and year. It is the companion series to the OurTop10 Mortgage Stress Report: stress measures who is under pressure now; default risk measures who may not make it through the cycle.
Definition: A default is a missed payment that flags the loan with the lender as out of order. DFA estimates the likelihood of default over the next 12 months, combining more than 25 years of loan history with current and future household cash-flow stress. Counts are modelled estimates of households at risk, not loans currently in default.
Note: Hobart/TAS is excluded from the default rankings as sample sizes are too small for reliable estimates. Figures reflect each state/territory’s top 10 ranked postcodes for default risk, which extend beyond strict metro boundaries in several cases. City/state labels reflect the ranking group, not metro-area totals.
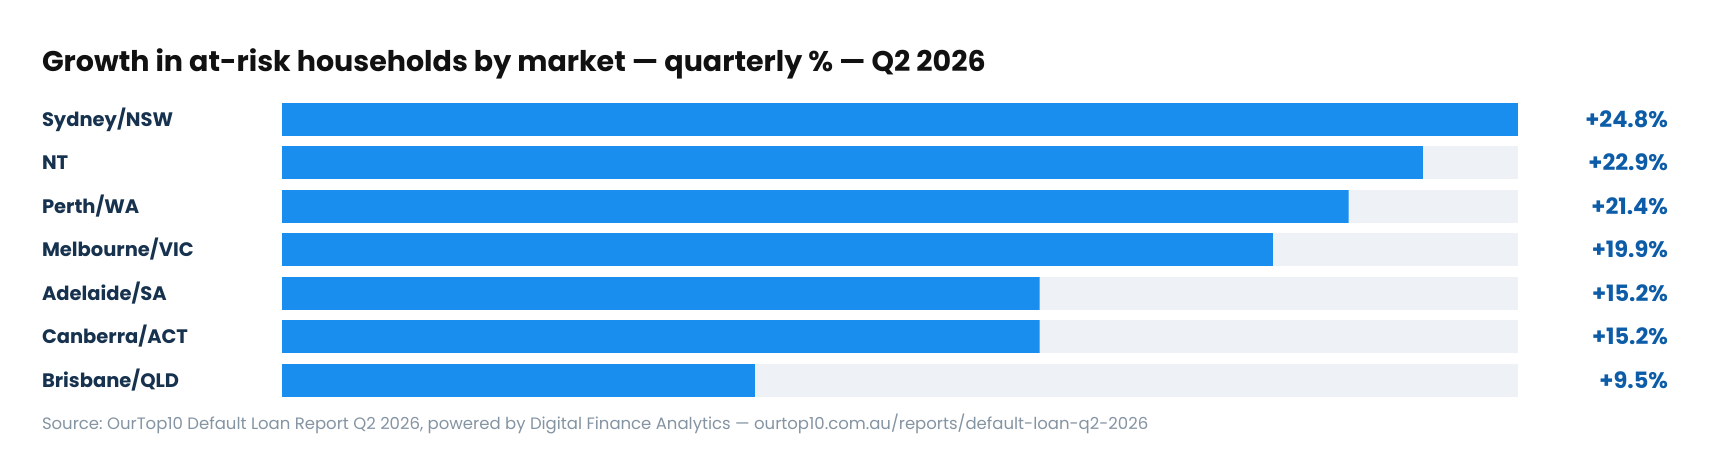
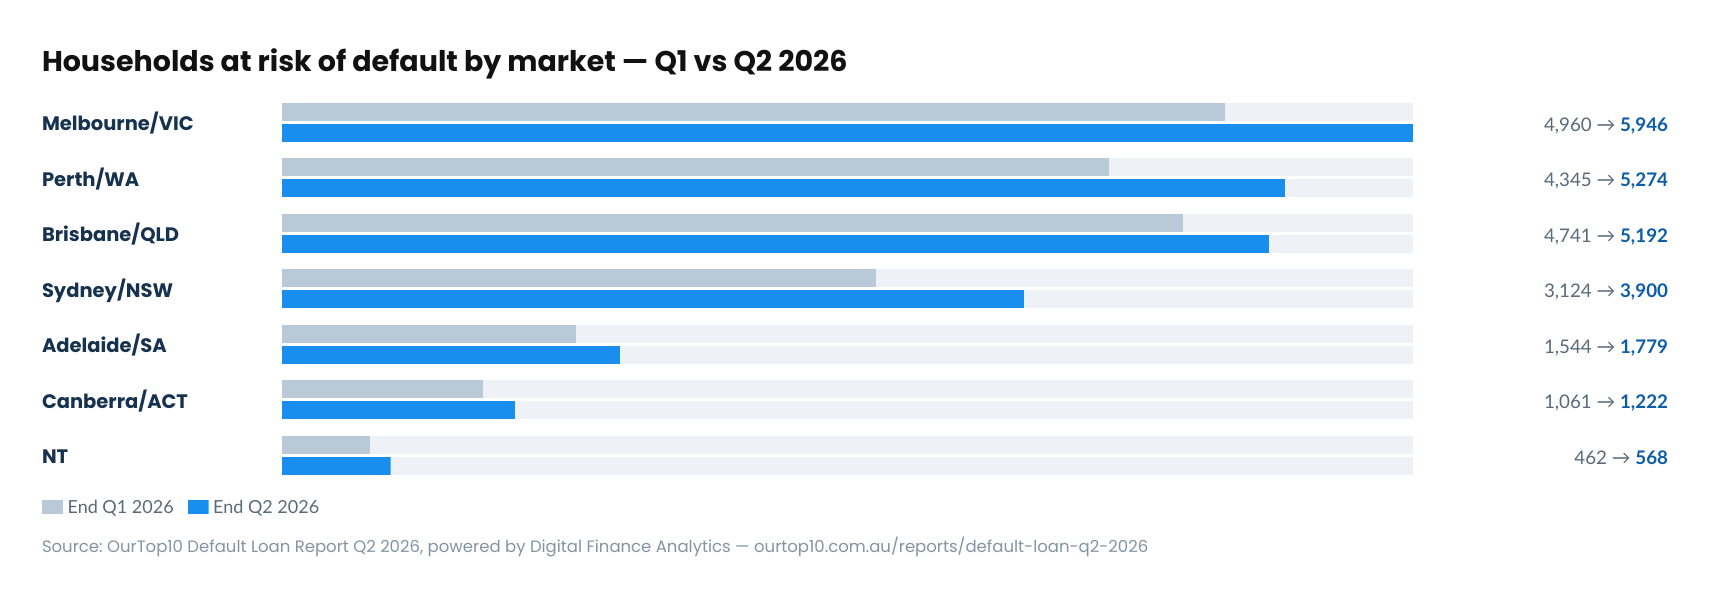
| Capital city/state | Net increase (Q2 2026) | Quarterly change | Total households at risk of default (ranked postcodes) |
|---|---|---|---|
| Sydney/NSW | +776 | ▲ +24.8% | 3,900 |
| NT | +106 | ▲ +22.9% | 568 |
| Perth/WA | +929 | ▲ +21.4% | 5,274 |
| Melbourne/VIC | +986 | ▲ +19.9% | 5,946 |
| Adelaide/SA | +235 | ▲ +15.2% | 1,779 |
| Canberra/ACT | +161 | ▲ +15.2% | 1,222 |
| Brisbane/QLD | +451 | ▲ +9.5% | 5,192 |

“Stress tells you who is struggling this quarter. Default risk tells you who may not make it through the cycle.”

“Stress is a precursor to default, which is a precursor to a forced sale.”
The biggest movers
Ranked in the exact order they appear in the Q2 2026 Default Loan Report — by quarterly and annual change in households at risk of default.
| # | Postcode | Suburb | Market | Qtr change |
|---|---|---|---|---|
| 1 | 3156 | Ferntree Gully | Melbourne/VIC | ▲ +166% |
| 2 | 2560 | Campbelltown | Sydney/NSW | ▲ +66% |
| 3 | 6107 | Beckenham | Perth/WA | ▲ +63% |
| 4 | 0810 | Nakara | NT | ▲ +56% |
| 5 | 2250 | Gosford | Sydney/NSW | ▲ +53% |
| 6 | 2077 | Hornsby | Sydney/NSW | ▲ +41% |
| 7 | 3029 | Tarneit | Melbourne/VIC | ▲ +41% |
| 8 | 5043 | Marion | Adelaide/SA | ▲ +39% |
| 9 | 4211 | Pacific Pines | Brisbane/QLD | ▲ +39% |
| 10 | 2617 | Kaleen | Canberra/ACT | ▲ +39% |
| # | Postcode | Suburb | Market | Annual change |
|---|---|---|---|---|
| 1 | 3156 | Ferntree Gully | Melbourne/VIC | ▲ +182% |
| 2 | 6163 | Samson | Perth/WA | ▲ +69% |
| 3 | 2560 | Campbelltown | Sydney/NSW | ▲ +49% |
| 4 | 2340 | South Tamworth | Sydney/NSW | ▲ +46% |
| 5 | 2077 | Hornsby | Sydney/NSW | ▲ +44% |
| 6 | 2906 | Banks | Canberra/ACT | ▲ +44% |
| 7 | 6107 | Beckenham | Perth/WA | ▲ +42% |
| 8 | 2602 | Ainslie | Canberra/ACT | ▲ +41% |
| 9 | 2606 | Lyons | Canberra/ACT | ▲ +38% |
| 10 | 3029 | Tarneit | Melbourne/VIC | ▲ +37% |
The 3–5 year lag: from stress to default
Default is not a sudden event. On Digital Finance Analytics’ analysis it takes three to five years on average from sustained cash-flow pressure to default. That lag means today’s default map reflects yesterday’s stress, and today’s stress data shows where defaults emerge next: mortgage stress (around 421,700 households in negative monthly cash flow) leads to severe stress (deeply, persistently negative), which 3–5 years later seasons into default risk (around 23,881 households across the 70 ranked postcodes).
The default rankings in this report are dominated by outer growth-corridor postcodes: Cranbourne, Tarneit, Campbelltown, Gosford, Ferntree Gully. One early crossover is visible: Hornsby (2077), up 41% in default risk this quarter — the first affluent postcode to feature prominently. And default is not the end of the chain: on DFA’s numbers, once a household defaults, more than half end up selling within the next couple of years.
Sydney: default risk snapshot
Sydney and surrounds are the fastest-growing default-risk market in the country, up 24.8% in a single quarter. The region’s 10 ranked postcodes now hold 3,900 households at risk of default, and 10 of the 10 rose over the quarter.
Campbelltown (2560) recorded the region’s sharpest quarterly rise, up 66% from 242 to 402 at-risk households, and is also up 49% over the year. Gosford (2250) was next, up 53% from 386 to 591, the largest at-risk count in NSW. The one to watch is Hornsby (2077) on the upper North Shore, up 41% for the quarter and 44% for the year — the first affluent postcode to feature prominently in the default rankings, a possible early sign of the blue-chip stress cohort converting.
| # | Postcode | Suburb | Region | At risk now | 3 mos ago | 12 mos ago | Qtr change | Annual change |
|---|---|---|---|---|---|---|---|---|
| 1 | 2250 | Gosford | Central Coast | 591 | 386 | 519 | ▲ +53.1% | ▲ +13.9% |
| 2 | 2259 | Wyong | Lake Macquarie | 452 | 437 | 419 | ▲ +3.4% | ▲ +7.9% |
| 3 | 2560 | Campbelltown | Campbelltown | 402 | 242 | 270 | ▲ +66.1% | ▲ +48.9% |
| 4 | 2155 | Beaumont Hills | The Hills Shire | 377 | 335 | 348 | ▲ +12.5% | ▲ +8.3% |
| 5 | 2077 | Hornsby | Hornsby | 364 | 258 | 253 | ▲ +41.1% | ▲ +43.9% |
| 6 | 2261 | Bateau Bay | Central Coast | 358 | 284 | 310 | ▲ +26.1% | ▲ +15.5% |
| 7 | 2650 | Turvey Park | Wagga Wagga | 355 | 351 | 329 | ▲ +1.1% | ▲ +7.9% |
| 8 | 2170 | Liverpool | Fairfield | 350 | 318 | 301 | ▲ +10.1% | ▲ +16.3% |
| 9 | 2340 | South Tamworth | Gunnedah | 345 | 288 | 237 | ▲ +19.8% | ▲ +45.6% |
| 10 | 2480 | Goonellabah | Byron | 306 | 225 | 266 | ▲ +36.0% | ▲ +15.0% |
Note: household counts are modelled estimates of households at risk of default. Movements off small bases can be volatile quarter to quarter.
Melbourne: default risk snapshot
Melbourne and surrounding regions hold the largest default-risk volumes in the country: 5,946 at-risk households across the 10 ranked postcodes, up 19.9% for the quarter and 20.5% for the year.
Ferntree Gully (3156) is the national shock stat. At-risk households rose 166% in three months, from 138 to 367, and 182% over the year — the sharpest move on either measure anywhere in Australia. Tarneit (3029) rose 41% to 994. Cranbourne (3977) remains the single largest default-risk hotspot in the country at 1,259 at-risk households, with the south-east growth corridor and outer west dominating Melbourne’s list.
| # | Postcode | Suburb | Region | At risk now | 3 mos ago | 12 mos ago | Qtr change | Annual change |
|---|---|---|---|---|---|---|---|---|
| 1 | 3977 | Cranbourne | Casey | 1,259 | 1,039 | 1,114 | ▲ +21.2% | ▲ +13.0% |
| 2 | 3029 | Tarneit | Wyndham | 994 | 706 | 723 | ▲ +40.8% | ▲ +37.5% |
| 3 | 3064 | Roxburgh Park | Hume | 775 | 709 | 727 | ▲ +9.3% | ▲ +6.6% |
| 4 | 3030 | Derrimut | Wyndham | 611 | 526 | 505 | ▲ +16.2% | ▲ +21.0% |
| 5 | 3978 | Clyde | Cardinia | 464 | 501 | 439 | ▼ -7.4% | ▲ +5.7% |
| 6 | 3216 | Highton | Greater Geelong | 409 | 347 | 360 | ▲ +17.9% | ▲ +13.6% |
| 7 | 3810 | Pakenham | Cardinia | 402 | 346 | 352 | ▲ +16.2% | ▲ +14.2% |
| 8 | 3156 | Ferntree Gully | Casey | 367 | 138 | 130 | ▲ +165.9% | ▲ +182.3% |
| 9 | 3754 | Doreen | Whittlesea | 355 | 369 | 322 | ▼ -3.8% | ▲ +10.2% |
| 10 | 3350 | Ballarat | Ballarat | 310 | 279 | 264 | ▲ +11.1% | ▲ +17.4% |
Note: household counts are modelled estimates of households at risk of default. Movements off small bases can be volatile quarter to quarter.
Brisbane: default risk snapshot
Queensland is this quarter’s moderating story. After leading the nation in Q1, growth in at-risk households slowed to +9.5%, the slowest of any market, though the state still holds 5,192 at-risk households across its 10 ranked postcodes.
Pacific Pines (4211) on the Gold Coast recorded the state’s largest quarterly rise, up 39% from 414 to 577. Toowoomba (4350) carries the state’s biggest volume at 647, with Coomera (4209) close behind on 589. Even with the slowdown, 7 of Queensland’s 10 ranked postcodes still recorded higher default risk over the quarter, and the state remains up 18.6% year on year.
| # | Postcode | Suburb | Region | At risk now | 3 mos ago | 12 mos ago | Qtr change | Annual change |
|---|---|---|---|---|---|---|---|---|
| 1 | 4350 | Toowoomba | Toowoomba | 647 | 523 | 515 | ▲ +23.7% | ▲ +25.6% |
| 2 | 4209 | Coomera | Gold Coast | 589 | 478 | 439 | ▲ +23.2% | ▲ +34.2% |
| 3 | 4211 | Pacific Pines | Scenic Rim | 577 | 414 | 626 | ▲ +39.4% | ▼ -7.8% |
| 4 | 4670 | Bundaberg | Bundaberg | 558 | 676 | 464 | ▼ -17.5% | ▲ +20.3% |
| 5 | 4740 | Mount Pleasant | Mackay | 538 | 424 | 411 | ▲ +26.9% | ▲ +30.9% |
| 6 | 4207 | Yatala | Logan | 503 | 584 | 409 | ▼ -13.9% | ▲ +23.0% |
| 7 | 4300 | Bellbird Park | Ipswich | 479 | 376 | 391 | ▲ +27.4% | ▲ +22.5% |
| 8 | 4510 | Caboolture | Moreton Bay | 444 | 478 | 420 | ▼ -7.1% | ▲ +5.7% |
| 9 | 4680 | Barney Point | Gladstone | 432 | 391 | 340 | ▲ +10.5% | ▲ +27.1% |
| 10 | 4655 | Craignish | Fraser Coast | 425 | 397 | 363 | ▲ +7.1% | ▲ +17.1% |
Note: household counts are modelled estimates of households at risk of default. Movements off small bases can be volatile quarter to quarter.
Perth: default risk snapshot
Perth and surrounding regions recorded the second-largest volume of at-risk households nationally (5,274) and the third-fastest quarterly growth (+21.4%). All 10 of the region’s ranked postcodes are higher than a year ago.
Beckenham (6107) recorded the west’s sharpest quarterly rise, up 63% from 281 to 459. Samson (6163) holds the state’s strongest annual run, up 69% over 12 months. By volume, Success (6164) leads the west at 787 at-risk households, ahead of Armadale (6112) on 699 and Wanneroo (6065) on 587.
| # | Postcode | Suburb | Region | At risk now | 3 mos ago | 12 mos ago | Qtr change | Annual change |
|---|---|---|---|---|---|---|---|---|
| 1 | 6164 | Success | Cockburn | 787 | 608 | 644 | ▲ +29.4% | ▲ +22.2% |
| 2 | 6112 | Armadale | Armadale | 699 | 657 | 690 | ▲ +6.4% | ▲ +1.3% |
| 3 | 6065 | Wanneroo | Wanneroo | 587 | 537 | 535 | ▲ +9.3% | ▲ +9.7% |
| 4 | 6163 | Samson | Cockburn | 499 | 362 | 295 | ▲ +37.8% | ▲ +69.2% |
| 5 | 6069 | Ellenbrook | Swan | 479 | 443 | 391 | ▲ +8.1% | ▲ +22.5% |
| 6 | 6030 | Merriwa | Wanneroo | 461 | 369 | 392 | ▲ +24.9% | ▲ +17.6% |
| 7 | 6055 | Henley Brook | Swan | 460 | 383 | 335 | ▲ +20.1% | ▲ +37.3% |
| 8 | 6107 | Beckenham | Canning | 459 | 281 | 323 | ▲ +63.3% | ▲ +42.1% |
| 9 | 6110 | Huntingdale | Gosnells | 422 | 353 | 374 | ▲ +19.5% | ▲ +12.8% |
| 10 | 6027 | Heathridge | Joondalup | 421 | 352 | 342 | ▲ +19.6% | ▲ +23.1% |
Note: household counts are modelled estimates of households at risk of default. Movements off small bases can be volatile quarter to quarter.
Adelaide: default risk snapshot
Adelaide remains the most contained of the mainland capitals, with 1,779 at-risk households across its 10 ranked postcodes, though growth is still running at +15.2% for the quarter and +18.5% for the year.
Marion (5043) recorded Adelaide’s largest quarterly rise, up 39% from 109 to 152. Morphett Vale (5162) carries Adelaide’s biggest count at 247 at-risk households. Adelaide’s smaller base means postcode-level moves can be volatile, but the direction matches the national picture: pressure is building, not easing.
| # | Postcode | Suburb | Region | At risk now | 3 mos ago | 12 mos ago | Qtr change | Annual change |
|---|---|---|---|---|---|---|---|---|
| 1 | 5162 | Morphett Vale | Onkaparinga | 247 | 207 | 199 | ▲ +19.3% | ▲ +24.1% |
| 2 | 5159 | Happy Valley | Onkaparinga | 230 | 204 | 207 | ▲ +12.7% | ▲ +11.1% |
| 3 | 5108 | Paralowie | Salisbury | 209 | 175 | 181 | ▲ +19.4% | ▲ +15.5% |
| 4 | 5114 | Yattalunga | Playford | 209 | 173 | 178 | ▲ +20.8% | ▲ +17.4% |
| 5 | 5158 | Hallett Cove | Marion | 186 | 168 | 142 | ▲ +10.7% | ▲ +31.0% |
| 6 | 5043 | Marion | Marion | 152 | 109 | 118 | ▲ +39.4% | ▲ +28.8% |
| 7 | 5085 | Clearview | Port Adelaide Enfield | 142 | 173 | 124 | ▼ -17.9% | ▲ +14.5% |
| 8 | 5023 | Seaton | Charles Sturt | 138 | 107 | 129 | ▲ +29.0% | ▲ +7.0% |
| 9 | 5290 | Mount Gambier | Mount Gambier | 136 | 116 | 123 | ▲ +17.2% | ▲ +10.6% |
| 10 | 5251 | Mount Barker | Mount Barker | 130 | 112 | 100 | ▲ +16.1% | ▲ +30.0% |
Note: household counts are modelled estimates of households at risk of default. Movements off small bases can be volatile quarter to quarter.
Canberra: default risk snapshot
Canberra’s default-risk base is small (1,222 at-risk households) but its growth rate is not: +15.2% for the quarter, with 8 of 10 ranked postcodes rising. The ACT holds three of the nation’s 10 fastest annual risers: Banks (+44%), Ainslie (+41%) and Lyons (+38%). Kaleen (2617) recorded the territory’s sharpest quarterly rise at +39%, echoing its appearance among the fastest-growing mortgage stress postcodes.
| # | Postcode | Suburb | Region | At risk now | 3 mos ago | 12 mos ago | Qtr change | Annual change |
|---|---|---|---|---|---|---|---|---|
| 1 | 2914 | Amaroo | Canberra | 226 | 205 | 211 | ▲ +10.2% | ▲ +7.1% |
| 2 | 2615 | Latham | Canberra | 181 | 150 | 150 | ▲ +20.7% | ▲ +20.7% |
| 3 | 2913 | Ngunnawal | Canberra | 156 | 145 | 138 | ▲ +7.6% | ▲ +13.0% |
| 4 | 2602 | Ainslie | Canberra | 123 | 89 | 87 | ▲ +38.2% | ▲ +41.4% |
| 5 | 2617 | Kaleen | Canberra | 118 | 85 | 93 | ▲ +38.8% | ▲ +26.9% |
| 6 | 2611 | Weston | Canberra | 111 | 120 | 114 | ▼ -7.5% | ▼ -2.6% |
| 7 | 2905 | Calwell | Canberra | 100 | 83 | 83 | ▲ +20.5% | ▲ +20.5% |
| 8 | 2906 | Banks | Canberra | 79 | 62 | 55 | ▲ +27.4% | ▲ +43.6% |
| 9 | 2612 | Reid | Canberra | 73 | 58 | 56 | ▲ +25.9% | ▲ +30.4% |
| 10 | 2606 | Lyons | Canberra | 55 | 64 | 40 | ▼ -14.1% | ▲ +37.5% |
Note: household counts are modelled estimates of households at risk of default. Movements off small bases can be volatile quarter to quarter.
Northern Territory (NT): default risk snapshot
The Northern Territory has the smallest default-risk base in the index (568 at-risk households) but the second-fastest growth: +22.9% for the quarter and +26.8% for the year, the strongest annual rate nationally. Nakara (0810) in Darwin’s northern suburbs recorded the Territory’s sharpest quarterly rise, up 56% from 75 to 117. Movements off small bases can be volatile quarter to quarter, but the Territory’s trend has now run in one direction for a full year.
| # | Postcode | Suburb | Region | At risk now | 3 mos ago | 12 mos ago | Qtr change | Annual change |
|---|---|---|---|---|---|---|---|---|
| 1 | 0810 | Nakara | Darwin | 117 | 75 | 89 | ▲ +56.0% | ▲ +31.5% |
| 2 | 0832 | Bakewell | Palmerston | 84 | 69 | 67 | ▲ +21.7% | ▲ +25.4% |
| 3 | 0870 | Stuart | Alice Springs | 78 | 68 | 62 | ▲ +14.7% | ▲ +25.8% |
| 4 | 0830 | Marlow Lagoon | Palmerston | 75 | 63 | 65 | ▲ +19.0% | ▲ +15.4% |
| 5 | 0812 | Leanyer | Darwin | 71 | 63 | 63 | ▲ +12.7% | ▲ +12.7% |
| 6 | 0820 | Larrakeyah | Darwin | 52 | 40 | 38 | ▲ +30.0% | ▲ +36.8% |
| 7 | 0836 | Humpty Doo | Litchfield | 35 | 34 | 33 | ▲ +2.9% | ▲ +6.1% |
| 8 | 0822 | Livingstone | East Arnhem | 23 | 23 | – | · +0.0% | n/a* |
| 9 | 0850 | Katherine East | Katherine | 19 | 16 | 15 | ▲ +18.8% | ▲ +26.7% |
| 10 | 0800 | Darwin City | Darwin | 14 | 11 | 16 | — | — |
Note: household counts are modelled estimates of households at risk of default. Movements off small bases can be volatile quarter to quarter. *No year-earlier figure available for comparison.
Methodology
The data behind this report comes from research carried out by Digital Finance Analytics (DFA), drawn from the same rolling survey program that powers the OurTop10 Mortgage Stress Report: around 4,500 households surveyed each month, scaled to reflect Australia’s roughly 10 million households and benchmarked against Census data and RBA lending exposure figures.
A default is a missed payment which flags the loan with the lender as out of order. Sometimes these self-cure; often they are an indicator of trouble ahead. DFA’s default estimate is a projection that combines the history of loans over more than 25 years with current and future household cash-flow stress, expressed as the number (and percentage) of borrowers estimated to be at risk of default over the next 12 months. Counts are modelled estimates, not loans currently in default or arrears figures reported by lenders.
Because default is a lagging outcome, on average three to five years from sustained cash-flow pressure, default risk moves more slowly than mortgage stress and is the more forward-looking of DFA’s severity measures. Once a household defaults, more than half end up selling within the next couple of years: stress is a precursor to default, and default is a precursor to a forced sale.
The analysis is done at a postcode level, not suburb, and smaller areas can be less reliable simply because there are fewer households to draw from. Hobart/TAS is excluded from the default rankings for this reason. Suburb and LGA pairings are representative localities; DFA’s geographic mapping is derived from detailed ABS statistical zones (around 28,000 nationally), which split across adjacent postcodes.
FAQs
What counts as a mortgage default in this data?
A default is a missed payment that flags the loan with the lender as out of order. Sometimes these self-cure; often they are an indicator of trouble ahead. DFA estimates the likelihood of default over the next 12 months — counts are modelled estimates of households at risk, not loans currently in default or lender arrears figures.
Is the data based on actual household data, modelling, or both?
Both. DFA’s default estimate combines more than 25 years of loan history with current and future household cash-flow stress, drawn from the same rolling survey program that powers the OurTop10 Mortgage Stress Report: around 4,500 households surveyed each month, scaled to Australia’s roughly 10 million households and benchmarked against Census data and RBA lending exposure figures.
How does default risk relate to mortgage stress?
Stress measures who is under cash-flow pressure now; default risk measures who may not make it through the cycle. On DFA’s analysis it takes three to five years on average from sustained cash-flow pressure to default, and once a household defaults, more than half end up selling within the next couple of years: stress is a precursor to default, which is a precursor to a forced sale.
Why is Hobart excluded from the default rankings?
Sample sizes in Tasmania are too small for reliable default estimates at postcode level, so Hobart/TAS is excluded from these rankings. Hobart is covered in the companion OurTop10 Mortgage Stress Report, where larger stressed-household counts support postcode-level reporting.
How reliable is the data at postcode versus suburb level?
The analysis is done at postcode level because it provides a statistically more reliable sample size. Suburb and LGA pairings are representative localities; DFA’s geographic mapping is derived from detailed ABS statistical zones (around 28,000 nationally), which split across adjacent postcodes.
Use our charts & data
Journalists and publishers are welcome to republish the charts, tables and data below. Attribution to “the OurTop10 Default Loan Report, powered by Digital Finance Analytics” with a link to this page is required.


Paste the code below into your article to use a chart. The source link is included.
About OurTop10
OurTop10 is an Australian comparison and research platform dedicated to helping consumers identify leading mortgage brokers, accountants, conveyancers and buyer’s agents across Australia’s major cities. In addition to comparison services, OurTop10 delivers market research, property insights and industry news. The Default Loan Report is published quarterly alongside the OurTop10 Mortgage Stress Report at ourtop10.com.au/reports/.
Downloads & media
All data in this report was produced by Digital Finance Analytics and is reproduced with permission. When reporting on these findings, please attribute to “the OurTop10 Default Loan Report, powered by Digital Finance Analytics” and link to this page.
Download the report (PDF) Data pack — CSVs, XLSX & charts (ZIP) Companion: Mortgage Stress ReportMedia contact: Mansour Soltani · 0405 500 981 · [email protected]