
Mortgage Stress Report Q3 2026
Postcode-level analysis of household mortgage stress across Australia by OurTop10 Research,
powered by Digital Finance Analytics’ rolling survey of 52,000 households.
Hear the report explained
Mansour Soltani, Head of Research at OurTop10, talks through the Q3 2026 findings with host Craig on the Aussie Real Estate Podcast: why more than 450,000 households in the ranked postcodes are spending more than they earn, why Melbourne has the biggest concentration of stretched households, and what is happening in regional areas.
National snapshot
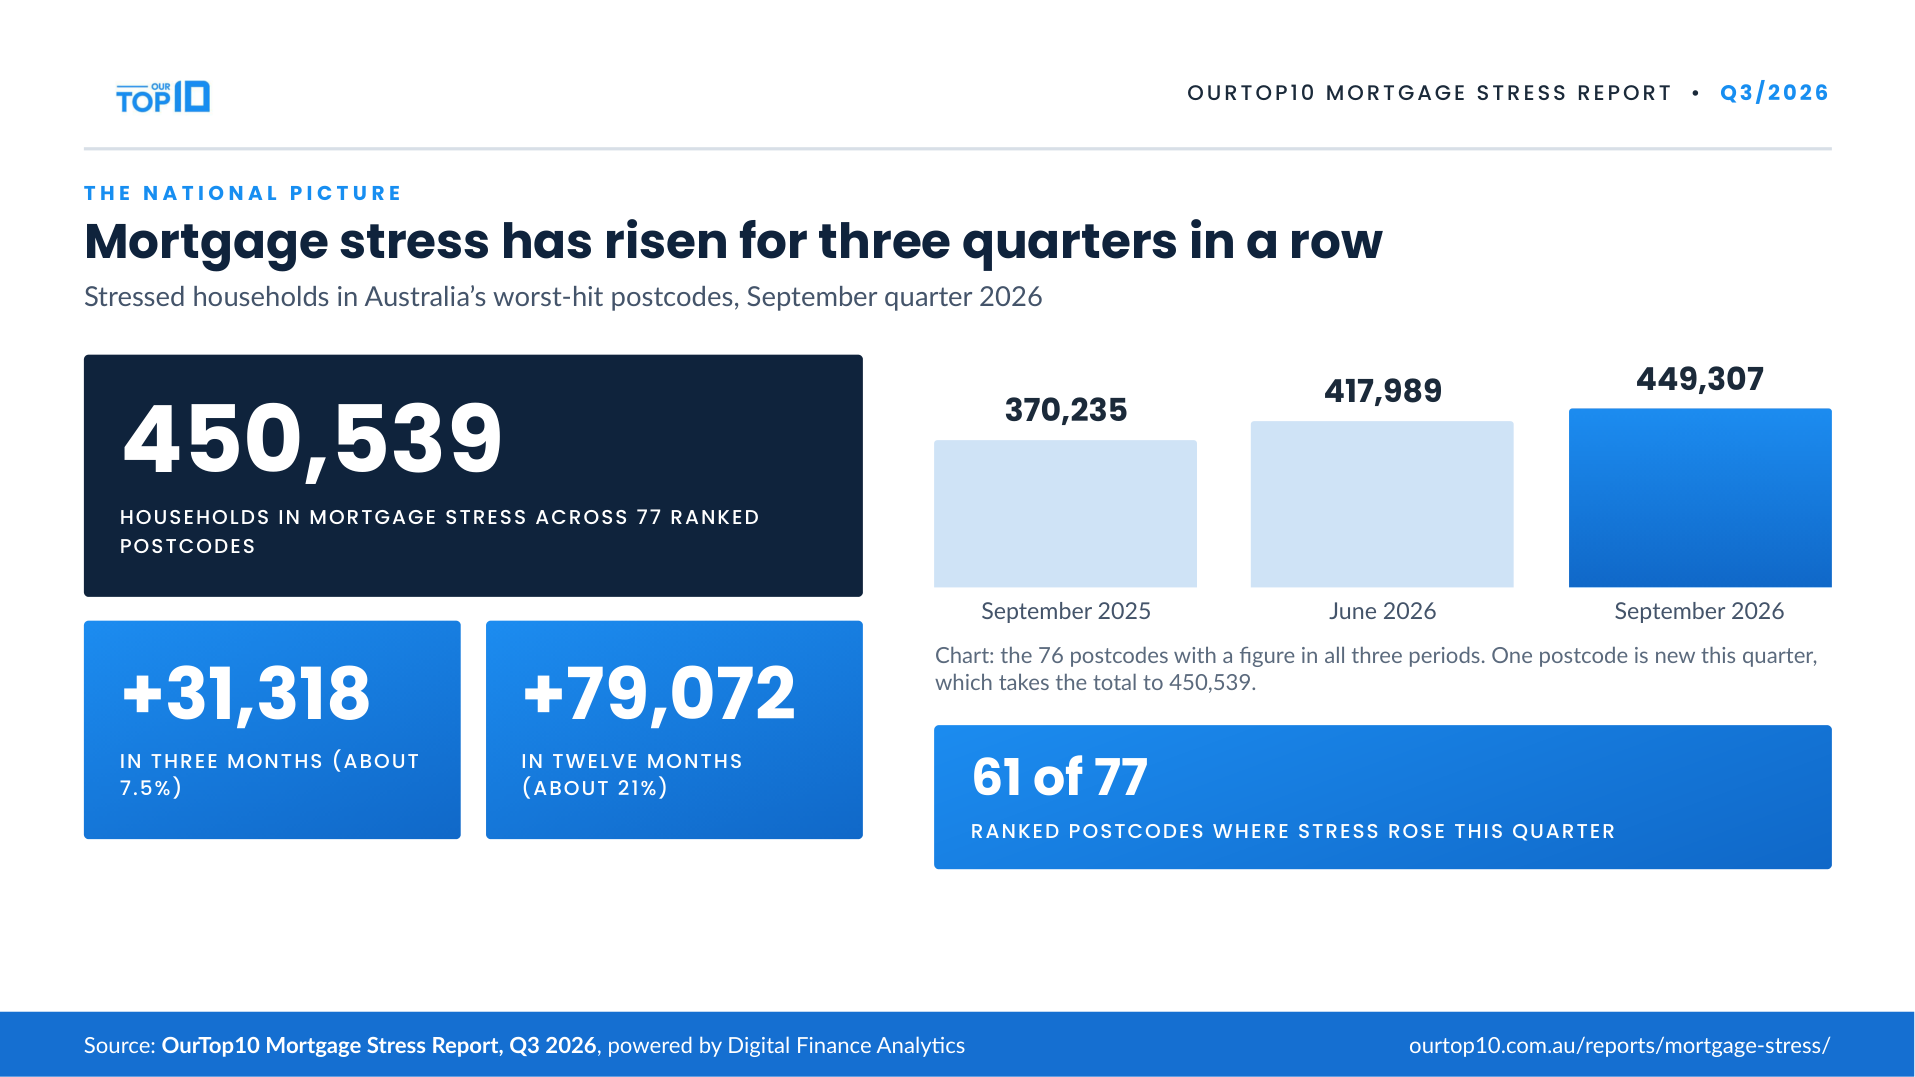
Across the 77 ranked mortgage stress postcodes nationally, the number of stressed households rose by a net 31,318 in Q3 2026, an increase of around 7.5% in three months. That takes the total to 450,539. The rise is measured across the 76 postcodes with a June figure, which climbed from 417,989 to 449,307; one postcode is new this quarter. 61 of the 77 ranked postcodes went up. It is the third quarterly rise in a row since the index launched. Over the year the same 76 postcodes added 79,072 stressed households (+21%).
New this quarter: a separate edition for each of the six states and the ACT, each with its own top-10 table, a March-to-September tracker and a severe-stress list. Jump to NSW, Victoria, Queensland, WA, SA, Tasmania or the ACT, or download all eight PDFs under Downloads.
Net new stressed households by market — Q3 2026
Total stressed households — Q2 vs Q3 2026
End Q2 2026 End Q3 2026
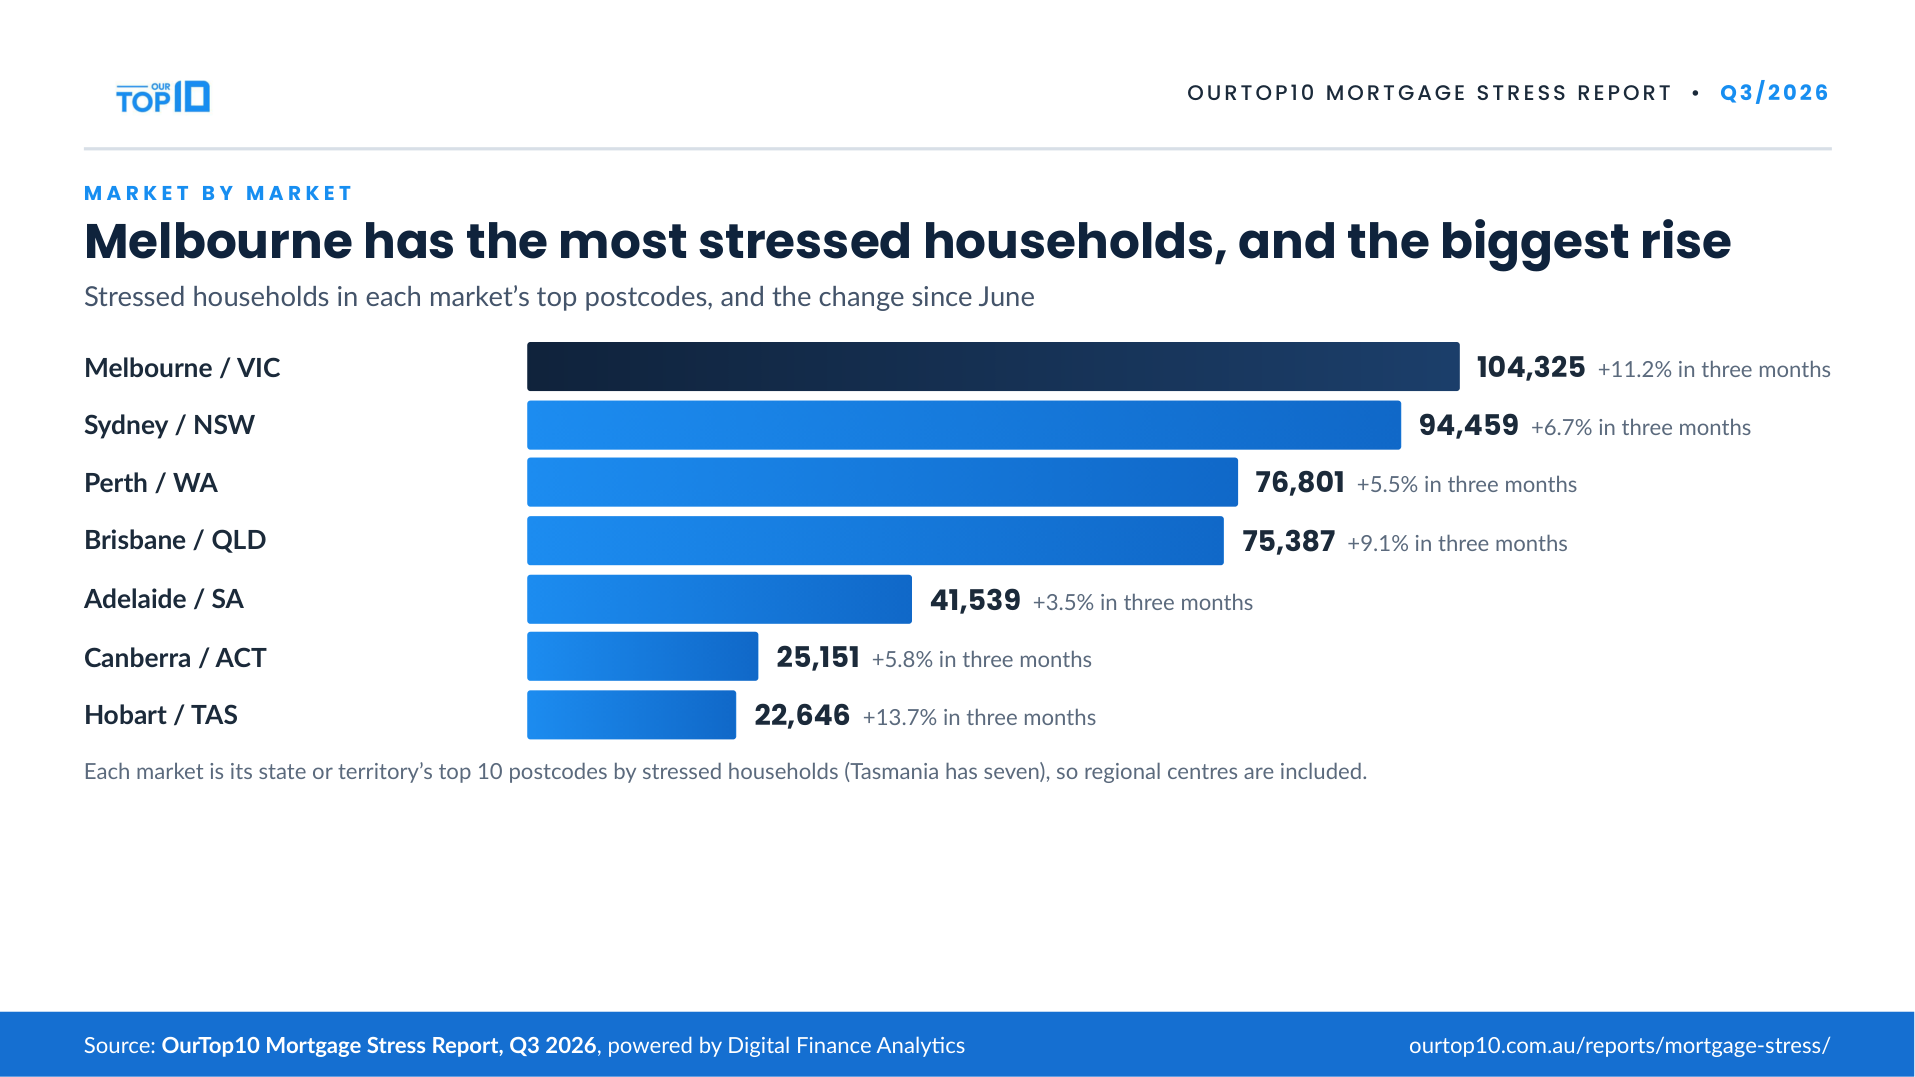
| Market | Postcodes | Net increase (Q3 2026) | % change (qtr) | Total stressed households |
|---|---|---|---|---|
| Melbourne/VIC | 10 | +10,501 | +11.2% | 104,325 |
| Brisbane/QLD | 10 | +6,295 | +9.1% | 75,387 |
| Sydney/NSW | 10 | +5,923 | +6.7% | 94,459 |
| Perth/WA | 10 | +3,994 | +5.5% | 76,801 |
| Hobart/TAS | 7 | +2,725 | +13.7% | 22,646 |
| Adelaide/SA | 10 | +1,418 | +3.5% | 41,539 |
| Canberra/ACT | 10 | +1,388 | +5.8% | 25,151 |
The seven markets shown add up to 440,308 stressed households. National totals also include ten Northern Territory postcodes, which are not reported separately this quarter.

“This past quarter has seen a marked rise in households experiencing mortgage stress across the country. Stress is spreading into more wealthy areas, who in theory have more buffers and options, but in practice have bigger living expenses, and bigger mortgages to match their bigger incomes. Next time, we expect stress to go higher still and continue to spread. We are at a tipping point.”

“Melbourne is now the centre of the story: more stressed households than any other market, and the biggest rise. But the sharpest moves are in the regions — Cairns, Toowoomba, Launceston.”
Biggest movers
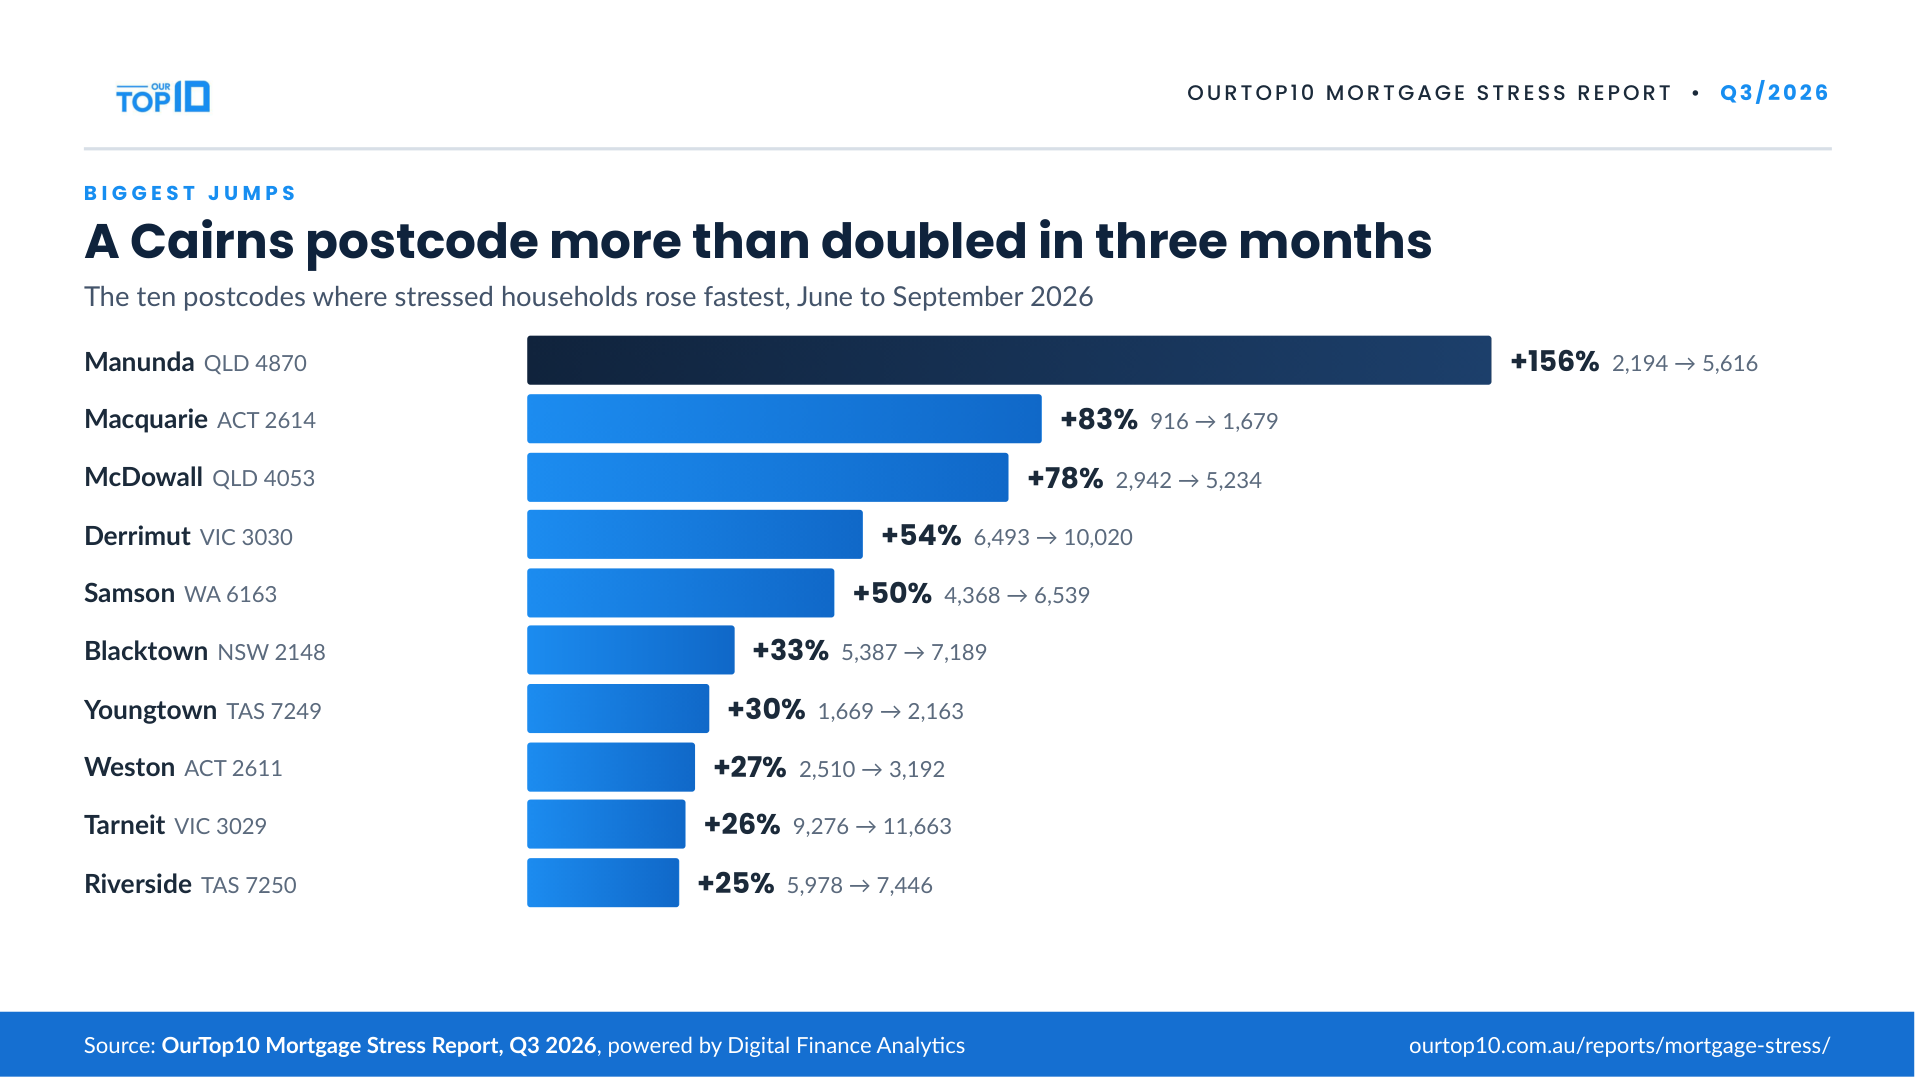
Biggest quarterly increases
- QLD 4870 (Manunda, Cairns)+156%
- ACT 2614 (Macquarie, Canberra)+83%
- QLD 4053 (McDowall, Brisbane)+78%
- VIC 3030 (Derrimut, Wyndham)+54%
- WA 6163 (Samson, Cockburn)+50%
- NSW 2148 (Blacktown, Blacktown)+33%
- TAS 7249 (Youngtown, Launceston)+30%
- ACT 2611 (Weston, Canberra)+27%
- VIC 3029 (Tarneit, Wyndham)+26%
- TAS 7250 (Riverside, Launceston)+25%
Biggest annual increases
- ACT 2614 (Macquarie, Canberra)+84%
- QLD 4053 (McDowall, Brisbane)+69%
- SA 5038 (South Plympton, Marion)+68%
- ACT 2905 (Calwell, Canberra)+65%
- TAS 7249 (Youngtown, Launceston)+62%
- WA 6164 (Success, Cockburn)+60%
- VIC 3064 (Roxburgh Park, Hume)+53%
- TAS 7010 (Rosetta, Glenorchy)+50%
- NSW 2148 (Blacktown, Blacktown)+47%
- QLD 4870 (Manunda, Cairns)+47%
Ranked by percentage change in stressed households. Postcodes with no prior-period figure are excluded; movements off small bases (ACT, Tasmania) can be volatile.
Infographics you can use
Free to publish with credit to the OurTop10 Mortgage Stress Report. Click any picture to open it full size. Each state section below has its own, and all eleven are in the media kit.
Where stress is growing: March to September 2026
Each ranked postcode traced back through the March and June reports. Across the 71 postcodes with a March figure, stressed households rose from 353,131 to 419,989, up 19% in six months, and 64 of the 71 rose. The 15 fastest risers among the reported markets are below; each state section carries the full list for its market.
| # | Postcode | Suburb | Market | Sep 2025 | Mar 2026 | Jun 2026 | Sep 2026 | 6-month change |
|---|---|---|---|---|---|---|---|---|
| 1 | 6163 | Samson | Perth/WA | 6,032 | 2,389 | 4,368 | 6,539 | ▲ +174% |
| 2 | 6155 | Canning Vale | Perth/WA | 5,771 | 2,448 | 5,028 | 6,072 | ▲ +148% |
| 3 | 4300 | Bellbird Park | Brisbane/QLD | 5,882 | 5,370 | 8,034 | 7,838 | ▲ +46% |
| 4 | 4350 | Toowoomba | Brisbane/QLD | 11,700 | 10,228 | 13,178 | 14,853 | ▲ +45% |
| 5 | 6112 | Armadale | Perth/WA | 5,339 | 4,362 | 7,170 | 6,316 | ▲ +45% |
| 6 | 2904 | Monash | Canberra/ACT | 986 | 1,014 | 1,389 | 1,423 | ▲ +40% |
| 7 | 3037 | Sydenham | Melbourne/VIC | 7,247 | 6,263 | 8,665 | 8,698 | ▲ +39% |
| 8 | 7140 | New Norfolk | Hobart/TAS | 2,023 | 1,659 | 2,211 | 2,270 | ▲ +37% |
| 9 | 2148 | Blacktown | Sydney/NSW | 4,881 | 5,329 | 5,387 | 7,189 | ▲ +35% |
| 10 | 5125 | Golden Grove | Adelaide/SA | 3,091 | 2,802 | 3,597 | 3,771 | ▲ +35% |
| 11 | 2614 | Macquarie | Canberra/ACT | 911 | 1,263 | 916 | 1,679 | ▲ +33% |
| 12 | 5251 | Mount Barker | Adelaide/SA | 3,501 | 2,868 | 3,208 | 3,760 | ▲ +31% |
| 13 | 6164 | Success | Perth/WA | 4,782 | 5,878 | 7,197 | 7,665 | ▲ +30% |
| 14 | 6061 | Balga | Perth/WA | 4,414 | 4,926 | 6,082 | 6,419 | ▲ +30% |
| 15 | 4305 | Ipswich | Brisbane/QLD | 6,411 | 6,302 | 6,832 | 8,151 | ▲ +29% |
March figures come from the March 2026 extract or, where a postcode was not ranked in March, from the June extract’s prior-quarter column. The September 2025 column shows whether a rise is new pressure or a recovery of an earlier fall. Samson and Canning Vale in Perth, for example, are back near their year-ago levels after a dip in March.
New South Wales: top 10 mortgage stress postcodes
The ten worst-hit NSW postcodes now hold 94,459 stressed households. That is about 5,900 more than in June: up 6.7% for the quarter and 21.2% for the year. Nine of the ten went up.
Blacktown (2148) moved most, up 33% from 5,387 to 7,189. It also has the strongest annual growth in the state, at 47%. South Tamworth (2340) was next, up 19% from 6,379 to 7,608.
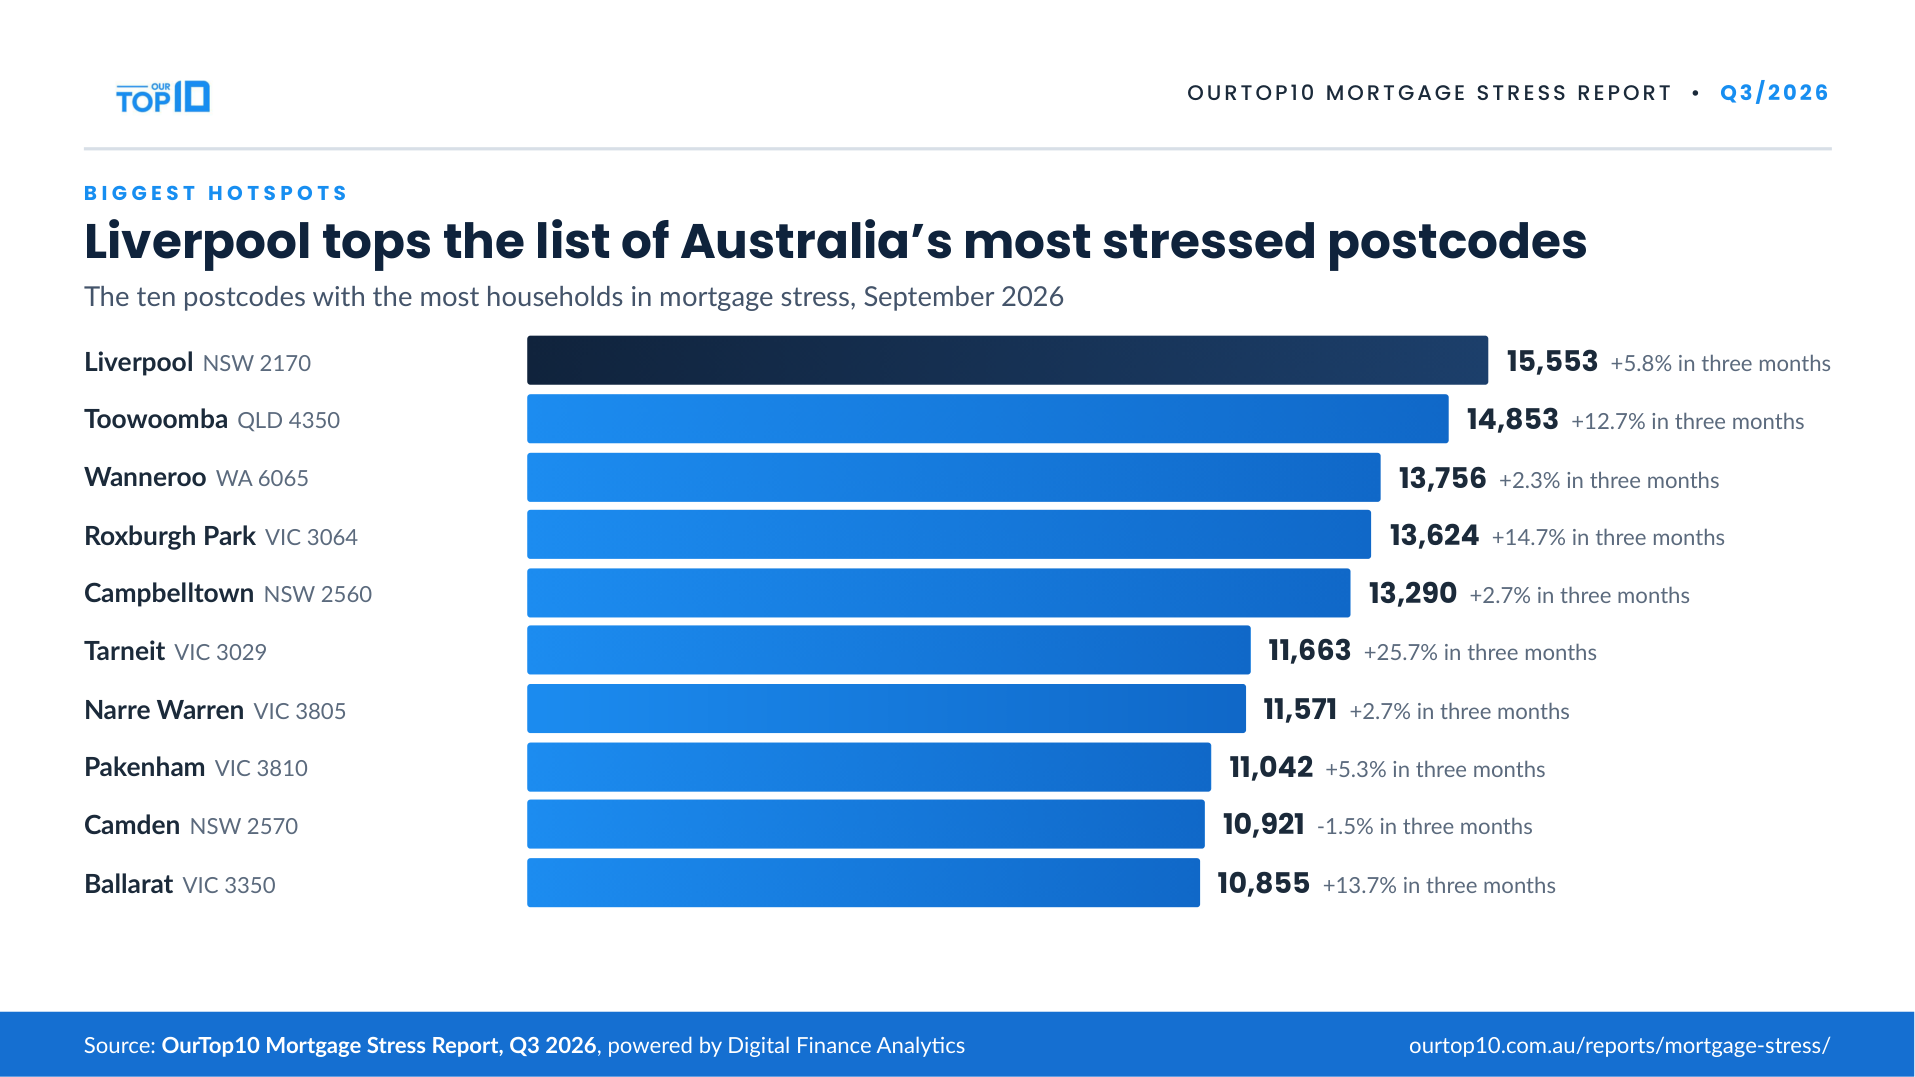
Liverpool (2170) is still the biggest hotspot in NSW, with 15,553 stressed households. That is 6% more than three months ago.
Most of the stress still sits in the south-west and north-west growth corridors: Liverpool, Campbelltown, Camden and Riverstone. Two regional centres, Tamworth and Orange, are now inside the NSW top 10.
Under pressure in Sydney? A local mortgage broker can review your loan and tell you what your options are.
Download the NSW edition (PDF) NSW data (CSV)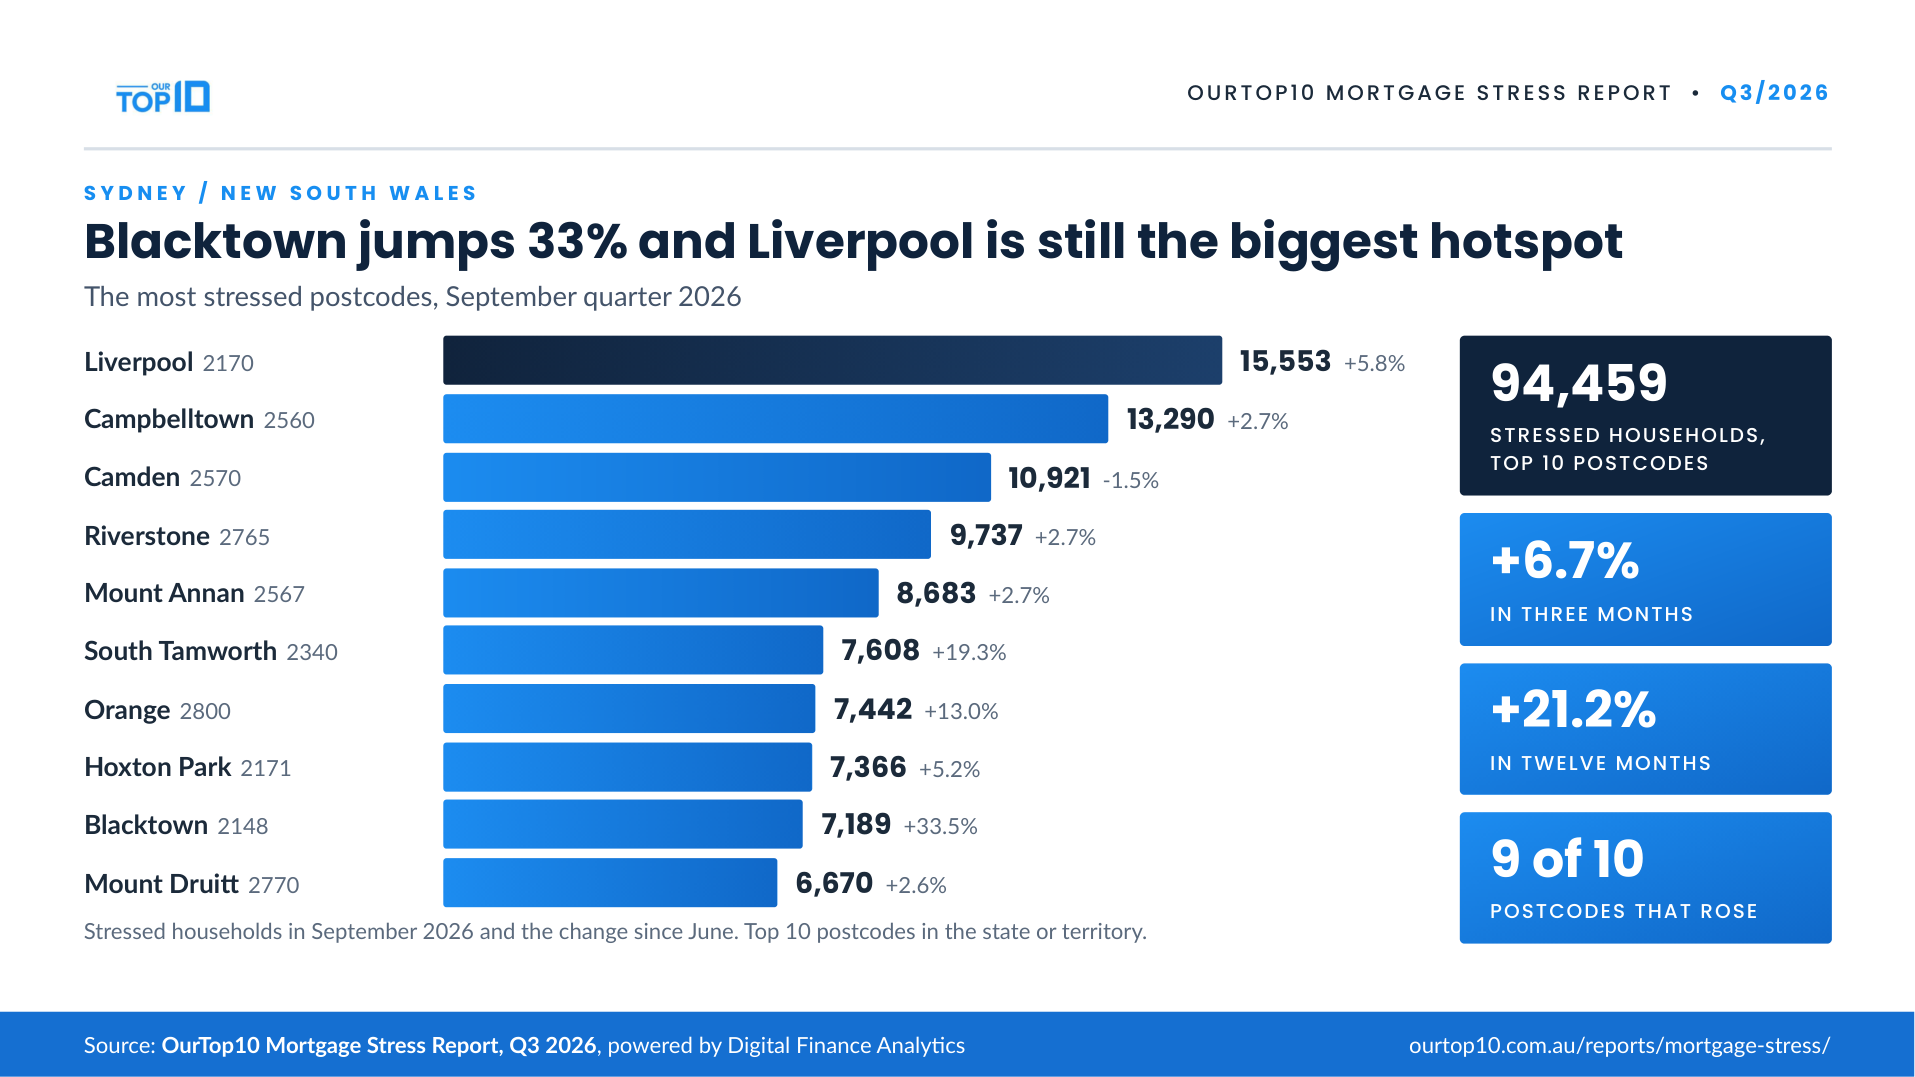
Top 10 NSW postcodes – biggest quarterly risers first
| # | Postcode | Suburb | LGA | Stressed now | 3 mos ago | 12 mos ago | Qtr change | Annual change |
|---|---|---|---|---|---|---|---|---|
| 1 | 2148 | Blacktown | Blacktown | 7,189 | 5,387 | 4,881 | ▲ +33.5% | ▲ +47.3% |
| 2 | 2340 | South Tamworth | Tamworth | 7,608 | 6,379 | 5,640 | ▲ +19.3% | ▲ +34.9% |
| 3 | 2800 | Orange | Orange | 7,442 | 6,587 | 6,549 | ▲ +13.0% | ▲ +13.6% |
| 4 | 2170 | Liverpool | Liverpool | 15,553 | 14,705 | 12,704 | ▲ +5.8% | ▲ +22.4% |
| 5 | 2171 | Hoxton Park | Liverpool | 7,366 | 7,002 | 5,495 | ▲ +5.2% | ▲ +34.0% |
| 6 | 2567 | Mount Annan | Camden | 8,683 | 8,458 | 7,084 | ▲ +2.7% | ▲ +22.6% |
| 7 | 2560 | Campbelltown | Campbelltown | 13,290 | 12,946 | 11,842 | ▲ +2.7% | ▲ +12.2% |
| 8 | 2765 | Riverstone | Blacktown | 9,737 | 9,485 | 8,676 | ▲ +2.7% | ▲ +12.2% |
| 9 | 2770 | Mount Druitt | Blacktown | 6,670 | 6,498 | 5,943 | ▲ +2.6% | ▲ +12.2% |
| 10 | 2570 | Camden | Camden | 10,921 | 11,089 | 9,140 | ▼ -1.5% | ▲ +19.5% |
Six-month tracker – March to September 2026
| # | Postcode | Suburb | Sep 2025 | Mar 2026 | Jun 2026 | Sep 2026 | 6-month change |
|---|---|---|---|---|---|---|---|
| 1 | 2148 | Blacktown | 4,881 | 5,329 | 5,387 | 7,189 | ▲ +35% |
| 2 | 2570 | Camden | 9,140 | 8,636 | 11,089 | 10,921 | ▲ +26% |
| 3 | 2171 | Hoxton Park | 5,495 | 6,253 | 7,002 | 7,366 | ▲ +18% |
| 4 | 2170 | Liverpool | 12,704 | 13,418 | 14,705 | 15,553 | ▲ +16% |
| 5 | 2567 | Mount Annan | 7,084 | 7,502 | 8,458 | 8,683 | ▲ +16% |
| 6 | 2800 | Orange | 6,549 | 6,768 | 6,587 | 7,442 | ▲ +10% |
| 7 | 2765 | Riverstone | 8,676 | 8,894 | 9,485 | 9,737 | ▲ +9% |
| 8 | 2560 | Campbelltown | 11,842 | 12,140 | 12,946 | 13,290 | ▲ +9% |
| 9 | 2770 | Mount Druitt | 5,943 | 6,093 | 6,498 | 6,670 | ▲ +9% |
| 10 | 2340 | South Tamworth | 5,640 | – | 6,379 | 7,608 | n/a* |
Severe mortgage stress – top 10 NSW postcodes
| # | Postcode | Suburb | LGA | Severe now | 3 mos ago | 12 mos ago | Qtr change | Annual change |
|---|---|---|---|---|---|---|---|---|
| 1 | 2047 | Drummoyne | Canada Bay | 1,591 | 224 | 274 | ▲ +610.3% | ▲ +480.7% |
| 2 | 2077 | Hornsby | Hornsby | 1,555 | 400 | – | ▲ +288.8% | n/a* |
| 3 | 2070 | Lindfield | Ku-ring-gai | 1,813 | 980 | 892 | ▲ +85.0% | ▲ +103.3% |
| 4 | 2093 | Balgowlah | Northern Beaches | 1,652 | 1,119 | 1,045 | ▲ +47.6% | ▲ +58.1% |
| 5 | 2031 | Randwick | Randwick | 2,242 | 1,769 | – | ▲ +26.7% | n/a* |
| 6 | 2075 | St Ives | Ku-ring-gai | 1,612 | 1,335 | 400 | ▲ +20.7% | ▲ +303.0% |
| 7 | 2088 | Mosman | Mosman | 3,098 | 2,612 | 1,722 | ▲ +18.6% | ▲ +79.9% |
| 8 | 2026 | Bondi Beach | Waverley | 3,710 | 3,274 | 202 | ▲ +13.3% | ▲ +1736.6% |
| 9 | 2021 | Paddington | Sydney | 2,105 | – | 1,457 | n/a* | ▲ +44.5% |
| 10 | 2209 | Beverly Hills | Canterbury-Bankstown | 2,061 | – | 303 | n/a* | ▲ +580.2% |
Ranked by quarterly change. Postcodes with no prior-period reading show n/a*; movements off small bases can be volatile.
Victoria: top 10 mortgage stress postcodes
Victoria has the biggest total in the index: 104,325 stressed households across its top 10 postcodes. The quarter added around 10,500, an 11.2% rise, and the annual increase is 25.4%. Nine of the ten postcodes rose.
Derrimut (3030) jumped 54%, from 6,493 to 10,020. Tarneit (3029) rose 26%, from 9,276 to 11,663. Both are in Wyndham, in Melbourne’s west.
Roxburgh Park (3064) is the largest hotspot and the fastest grower over the year: 13,624 stressed households, up 15% on the quarter and 53% in 12 months.
The western growth belt is now moving as fast as the south-east, and Roxburgh Park in Hume has overtaken the Casey corridor as the state’s biggest single hotspot.
In Melbourne and feeling the squeeze? A local mortgage broker can go through your loan with you.
Download the VIC edition (PDF) VIC data (CSV)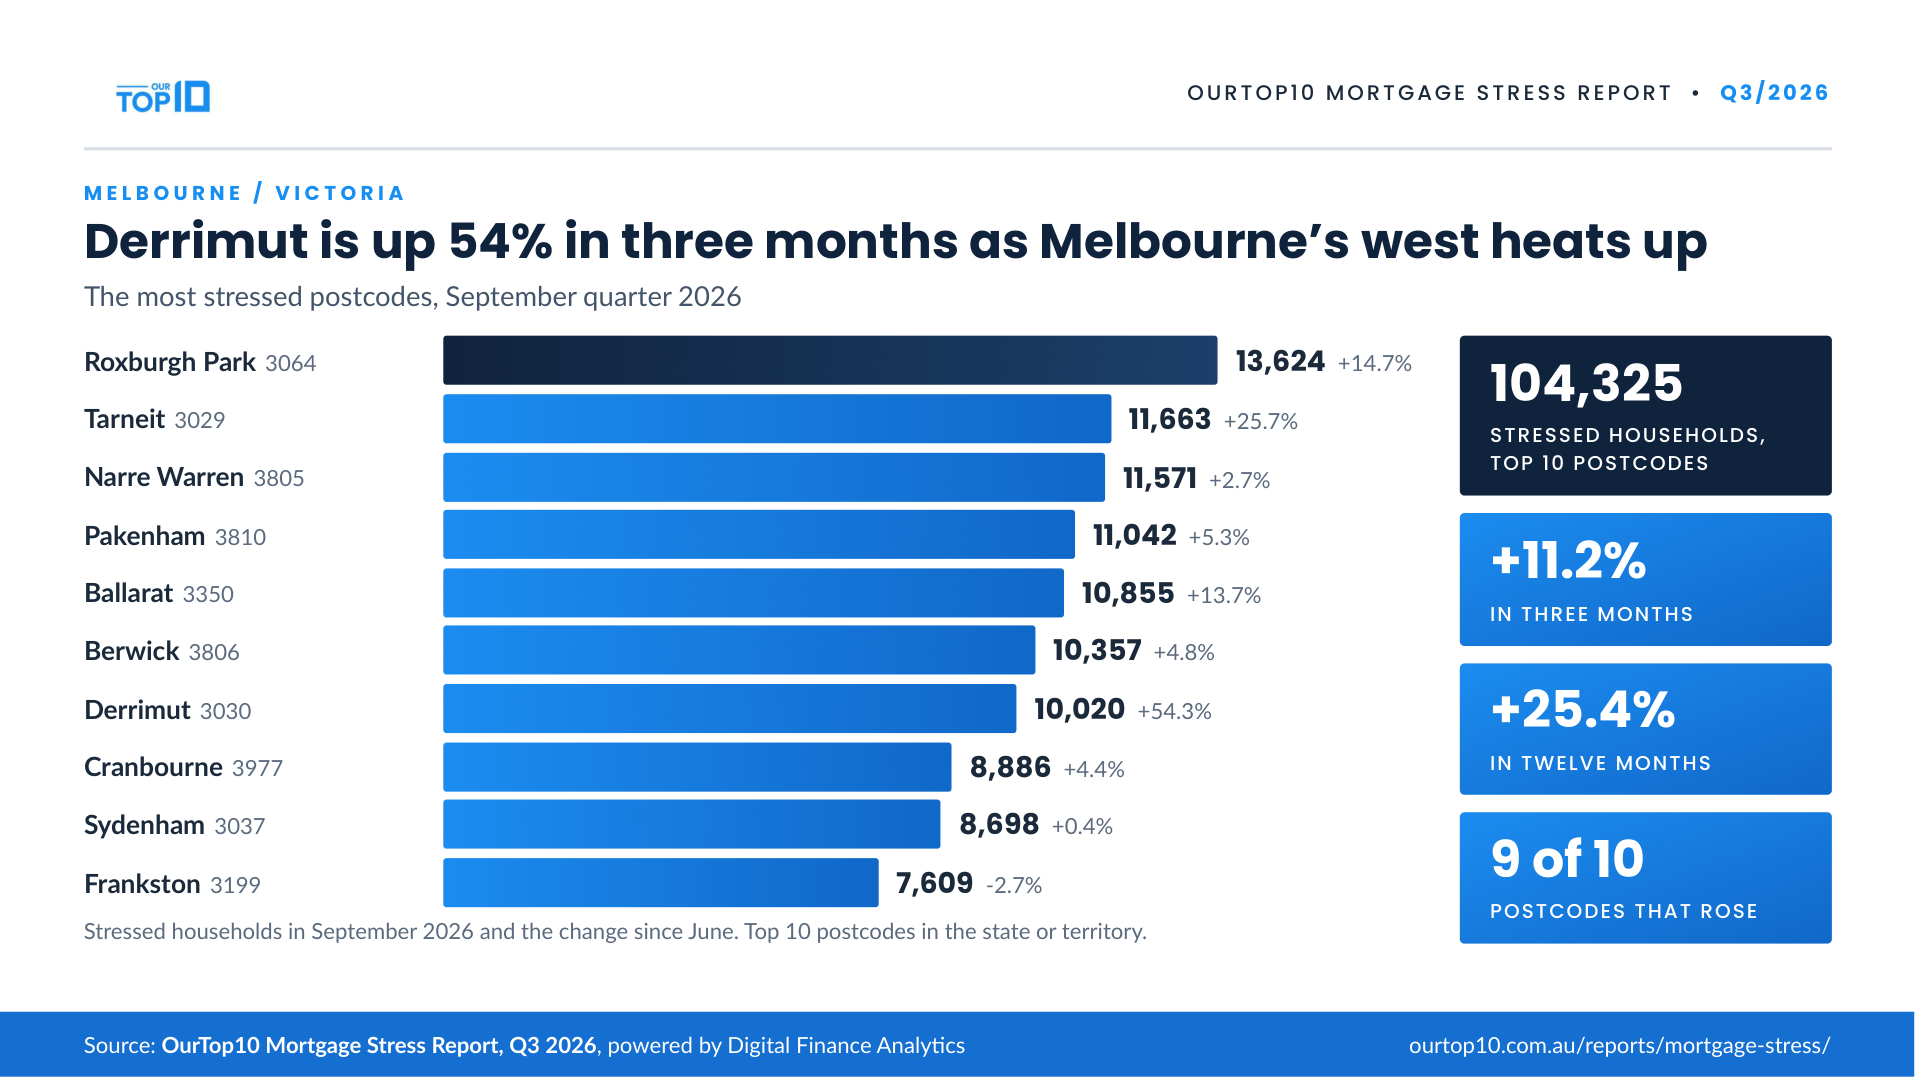
Top 10 VIC postcodes – biggest quarterly risers first
| # | Postcode | Suburb | LGA | Stressed now | 3 mos ago | 12 mos ago | Qtr change | Annual change |
|---|---|---|---|---|---|---|---|---|
| 1 | 3030 | Derrimut | Wyndham | 10,020 | 6,493 | 7,243 | ▲ +54.3% | ▲ +38.3% |
| 2 | 3029 | Tarneit | Wyndham | 11,663 | 9,276 | 8,426 | ▲ +25.7% | ▲ +38.4% |
| 3 | 3064 | Roxburgh Park | Hume | 13,624 | 11,875 | 8,926 | ▲ +14.7% | ▲ +52.6% |
| 4 | 3350 | Ballarat | Ballarat | 10,855 | 9,547 | 9,013 | ▲ +13.7% | ▲ +20.4% |
| 5 | 3810 | Pakenham | Cardinia | 11,042 | 10,491 | 8,988 | ▲ +5.3% | ▲ +22.9% |
| 6 | 3806 | Berwick | Casey | 10,357 | 9,878 | 9,036 | ▲ +4.8% | ▲ +14.6% |
| 7 | 3977 | Cranbourne | Casey | 8,886 | 8,509 | 8,018 | ▲ +4.4% | ▲ +10.8% |
| 8 | 3805 | Narre Warren | Casey | 11,571 | 11,272 | 9,729 | ▲ +2.7% | ▲ +18.9% |
| 9 | 3037 | Sydenham | Brimbank | 8,698 | 8,665 | 7,247 | ▲ +0.4% | ▲ +20.0% |
| 10 | 3199 | Frankston | Frankston | 7,609 | 7,818 | 6,563 | ▼ -2.7% | ▲ +15.9% |
Six-month tracker – March to September 2026
| # | Postcode | Suburb | Sep 2025 | Mar 2026 | Jun 2026 | Sep 2026 | 6-month change |
|---|---|---|---|---|---|---|---|
| 1 | 3037 | Sydenham | 7,247 | 6,263 | 8,665 | 8,698 | ▲ +39% |
| 2 | 3029 | Tarneit | 8,426 | 9,222 | 9,276 | 11,663 | ▲ +26% |
| 3 | 3064 | Roxburgh Park | 8,926 | 11,252 | 11,875 | 13,624 | ▲ +21% |
| 4 | 3030 | Derrimut | 7,243 | 8,318 | 6,493 | 10,020 | ▲ +20% |
| 5 | 3810 | Pakenham | 8,988 | 9,292 | 10,491 | 11,042 | ▲ +19% |
| 6 | 3350 | Ballarat | 9,013 | 9,165 | 9,547 | 10,855 | ▲ +18% |
| 7 | 3977 | Cranbourne | 8,018 | 7,512 | 8,509 | 8,886 | ▲ +18% |
| 8 | 3805 | Narre Warren | 9,729 | 10,193 | 11,272 | 11,571 | ▲ +14% |
| 9 | 3806 | Berwick | 9,036 | 9,263 | 9,878 | 10,357 | ▲ +12% |
| 10 | 3199 | Frankston | 6,563 | 7,005 | 7,818 | 7,609 | ▲ +9% |
Severe mortgage stress – top 10 VIC postcodes
| # | Postcode | Suburb | LGA | Severe now | 3 mos ago | 12 mos ago | Qtr change | Annual change |
|---|---|---|---|---|---|---|---|---|
| 1 | 3184 | Elwood | Port Phillip | 1,989 | 558 | – | ▲ +256.5% | n/a* |
| 2 | 3122 | Hawthorn | Boroondara | 1,499 | 624 | – | ▲ +140.2% | n/a* |
| 3 | 3124 | Camberwell | Boroondara | 2,025 | 1,118 | – | ▲ +81.1% | n/a* |
| 4 | 3146 | Glen Iris | Boroondara | 1,661 | 1,797 | – | ▼ -7.6% | n/a* |
| 5 | 3187 | Brighton East | Bayside | 2,166 | 2,460 | 558 | ▼ -12.0% | ▲ +288.2% |
| 6 | 3101 | Kew | Boroondara | 1,762 | 2,385 | – | ▼ -26.1% | n/a* |
| 7 | 3186 | Brighton | Bayside | 1,799 | 2,653 | – | ▼ -32.2% | n/a* |
| 8 | 3104 | Balwyn North | Boroondara | 1,554 | 2,865 | 2,385 | ▼ -45.8% | ▼ -34.8% |
| 9 | 3163 | Carnegie | Glen Eira | 1,835 | – | – | n/a* | n/a* |
| 10 | 3145 | Malvern East | Stonnington | 1,398 | – | 807 | n/a* | ▲ +73.2% |
Ranked by quarterly change. Postcodes with no prior-period reading show n/a*; movements off small bases can be volatile.
Queensland: top 10 mortgage stress postcodes
Queensland’s top 10 postcodes hold 75,387 stressed households, about 6,300 more than in June. That is up 9.1% in three months and 21.7% over the year. Seven of the ten rose and three fell.
Manunda in Cairns (4870) went from 2,194 to 5,616, a 156% rise and the steepest of any postcode in Australia. McDowall (4053), in Brisbane, climbed 78% from 2,942 to 5,234.
Toowoomba (4350) is the largest hotspot with 14,853 stressed households, up 13% on the quarter. McDowall has grown fastest over 12 months, up 69%.
Much of Queensland’s stress is regional. Outside Sydney and Melbourne, no postcode in the country has more stressed households than Toowoomba.
Brisbane borrowers can ask a local mortgage broker to check whether a better deal is available.
Download the QLD edition (PDF) QLD data (CSV)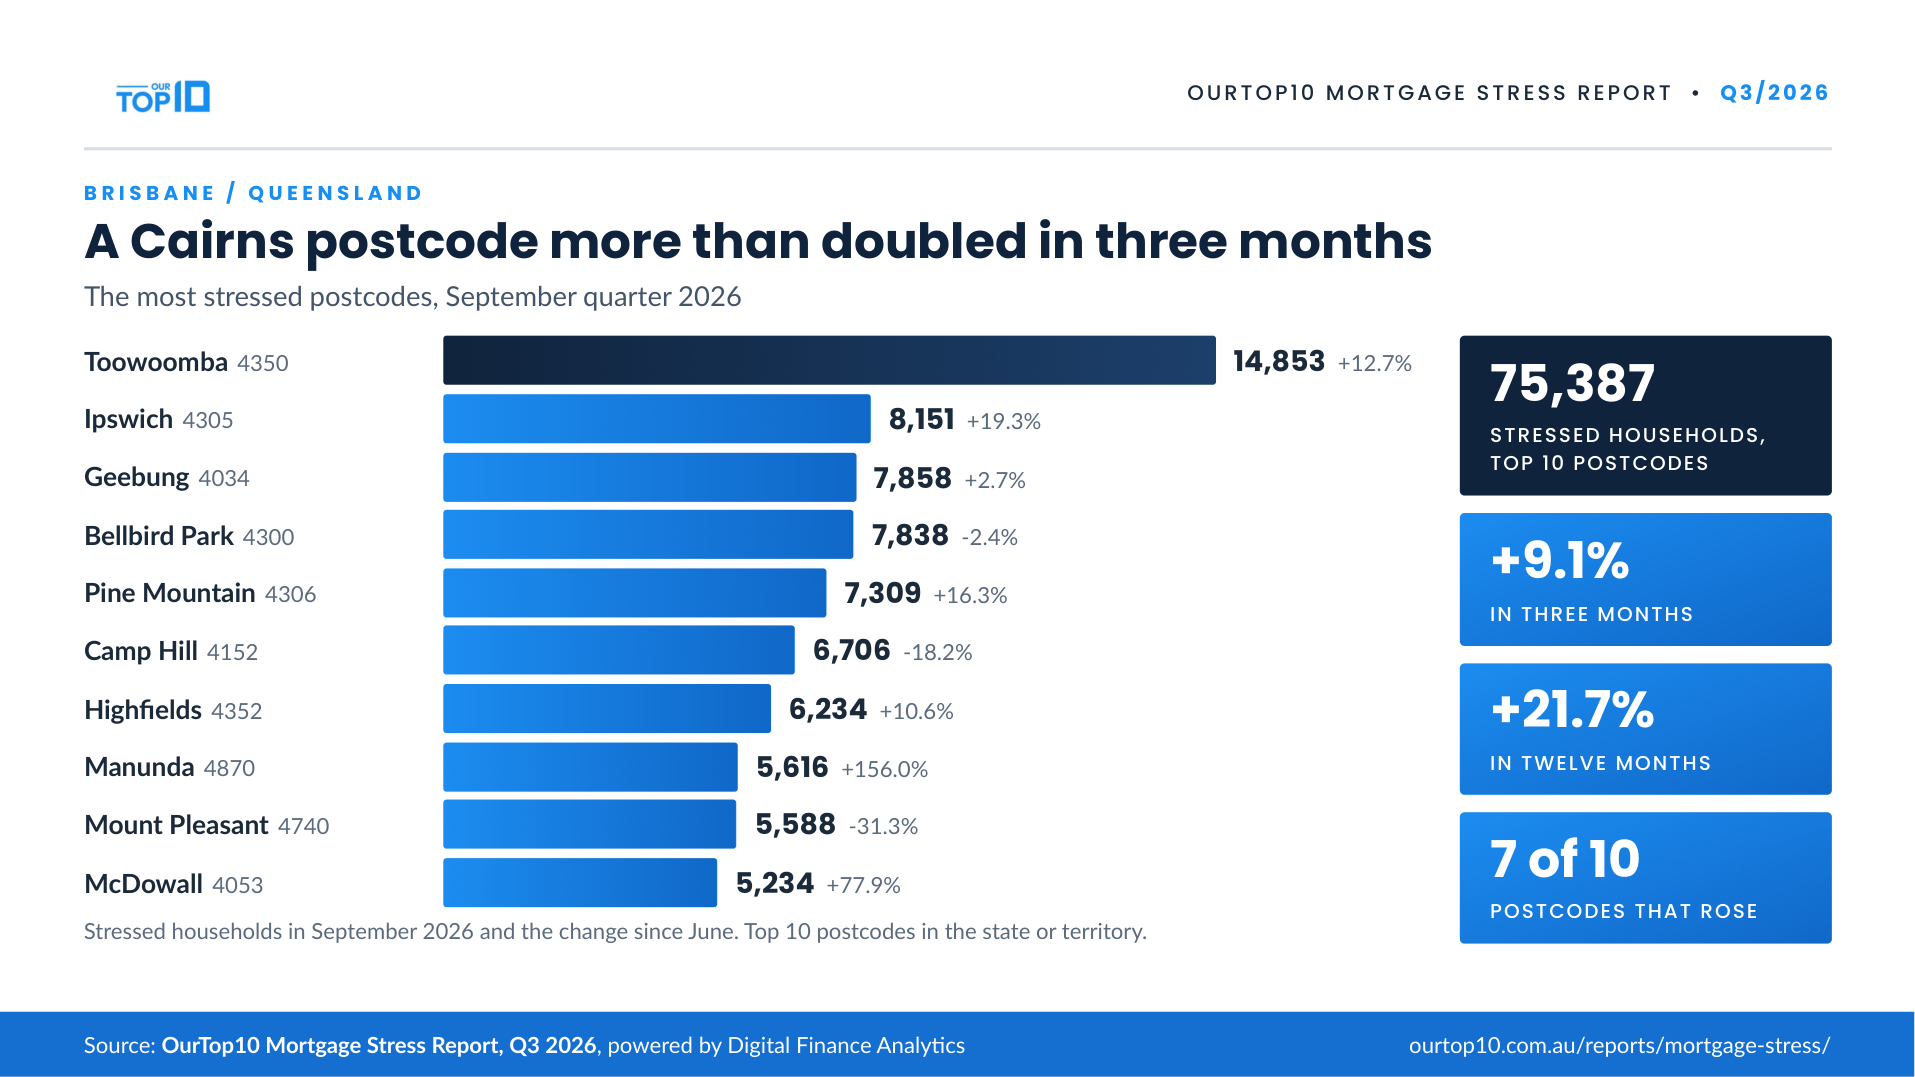
Top 10 QLD postcodes – biggest quarterly risers first
| # | Postcode | Suburb | LGA | Stressed now | 3 mos ago | 12 mos ago | Qtr change | Annual change |
|---|---|---|---|---|---|---|---|---|
| 1 | 4870 | Manunda | Cairns | 5,616 | 2,194 | 3,814 | ▲ +156.0% | ▲ +47.2% |
| 2 | 4053 | McDowall | Brisbane | 5,234 | 2,942 | 3,102 | ▲ +77.9% | ▲ +68.7% |
| 3 | 4305 | Ipswich | Ipswich | 8,151 | 6,832 | 6,411 | ▲ +19.3% | ▲ +27.1% |
| 4 | 4306 | Pine Mountain | Ipswich | 7,309 | 6,282 | 7,401 | ▲ +16.3% | ▼ -1.2% |
| 5 | 4350 | Toowoomba | Toowoomba | 14,853 | 13,178 | 11,700 | ▲ +12.7% | ▲ +26.9% |
| 6 | 4352 | Highfields | Toowoomba | 6,234 | 5,639 | 5,050 | ▲ +10.6% | ▲ +23.4% |
| 7 | 4034 | Geebung | Brisbane | 7,858 | 7,655 | 6,578 | ▲ +2.7% | ▲ +19.5% |
| 8 | 4300 | Bellbird Park | Ipswich | 7,838 | 8,034 | 5,882 | ▼ -2.4% | ▲ +33.3% |
| 9 | 4152 | Camp Hill | Brisbane | 6,706 | 8,197 | 6,289 | ▼ -18.2% | ▲ +6.6% |
| 10 | 4740 | Mount Pleasant | Mackay | 5,588 | 8,139 | 5,703 | ▼ -31.3% | ▼ -2.0% |
Six-month tracker – March to September 2026
| # | Postcode | Suburb | Sep 2025 | Mar 2026 | Jun 2026 | Sep 2026 | 6-month change |
|---|---|---|---|---|---|---|---|
| 1 | 4300 | Bellbird Park | 5,882 | 5,370 | 8,034 | 7,838 | ▲ +46% |
| 2 | 4350 | Toowoomba | 11,700 | 10,228 | 13,178 | 14,853 | ▲ +45% |
| 3 | 4305 | Ipswich | 6,411 | 6,302 | 6,832 | 8,151 | ▲ +29% |
| 4 | 4034 | Geebung | 6,578 | 6,922 | 7,655 | 7,858 | ▲ +14% |
| 5 | 4352 | Highfields | 5,050 | 5,694 | 5,639 | 6,234 | ▲ +9% |
| 6 | 4152 | Camp Hill | 6,289 | 6,857 | 8,197 | 6,706 | ▼ -2% |
| 7 | 4740 | Mount Pleasant | 5,703 | 6,229 | 8,139 | 5,588 | ▼ -10% |
| 8 | 4306 | Pine Mountain | 7,401 | 8,345 | 6,282 | 7,309 | ▼ -12% |
| 9 | 4870 | Manunda | 3,814 | – | 2,194 | 5,616 | n/a* |
| 10 | 4053 | McDowall | 3,102 | – | 2,942 | 5,234 | n/a* |
Severe mortgage stress – top 10 QLD postcodes
| # | Postcode | Suburb | LGA | Severe now | 3 mos ago | 12 mos ago | Qtr change | Annual change |
|---|---|---|---|---|---|---|---|---|
| 1 | 4218 | Mermaid Waters | Gold Coast | 515 | 244 | – | ▲ +111.1% | n/a* |
| 2 | 4007 | Ascot | Brisbane | 392 | 209 | – | ▲ +87.6% | n/a* |
| 3 | 4567 | Sunrise Beach | Noosa | 631 | 767 | – | ▼ -17.7% | n/a* |
| 4 | 4220 | Miami | Gold Coast | 810 | – | – | n/a* | n/a* |
| 5 | 4216 | Paradise Point | Gold Coast | 758 | – | – | n/a* | n/a* |
| 6 | 4573 | Yaroomba | Sunshine Coast | 721 | – | – | n/a* | n/a* |
| 7 | 4553 | Mooloolah Valley | Sunshine Coast | 628 | – | – | n/a* | n/a* |
| 8 | 4568 | Pomona | Noosa | 329 | – | – | n/a* | n/a* |
| 9 | 4069 | Chapel Hill | Brisbane | 264 | – | – | n/a* | n/a* |
| 10 | 4116 | Calamvale | Brisbane | 243 | – | – | n/a* | n/a* |
Ranked by quarterly change. Postcodes with no prior-period reading show n/a*; movements off small bases can be volatile.
Western Australia: top 10 mortgage stress postcodes
Perth has cooled since leading the country last quarter. WA’s top 10 postcodes added about 4,000 stressed households, a 5.5% rise, to reach 76,801. The total is up 21.7% over the year, and eight of the ten rose.
Samson (6163, Cockburn) rose 50%, from 4,368 to 6,539. Canning Vale (6155) rose 21%, from 5,028 to 6,072.
Wanneroo (6065) is the largest hotspot at 13,756 stressed households, up 2% on the quarter. Success (6164) has grown fastest over 12 months, up 60%.
Samson, Success and Canning Vale in the Cockburn–Canning belt all rose. Samson and Canning Vale have both more than doubled since March, but each is back near its September 2025 level after a dip in March, so that is a recovery more than new pressure.
Download the WA edition (PDF) WA data (CSV)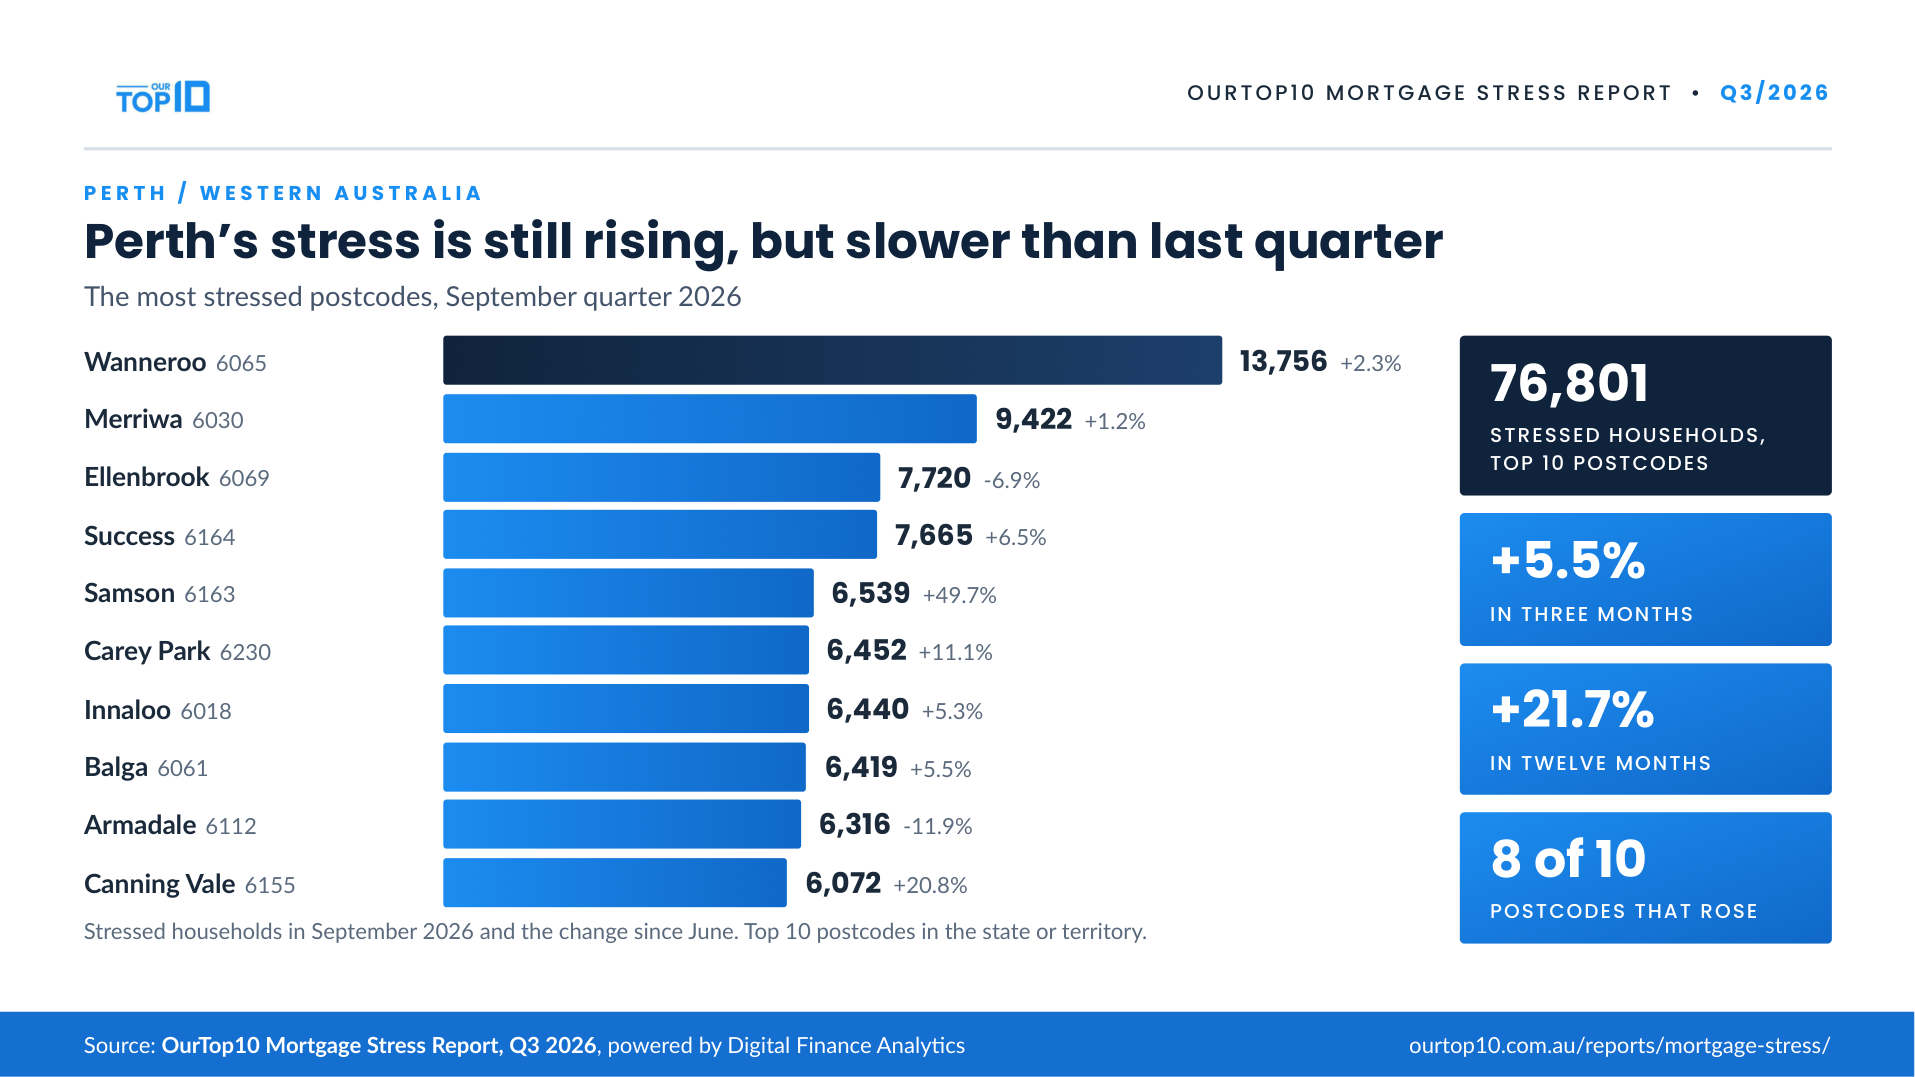
Top 10 WA postcodes – biggest quarterly risers first
| # | Postcode | Suburb | LGA | Stressed now | 3 mos ago | 12 mos ago | Qtr change | Annual change |
|---|---|---|---|---|---|---|---|---|
| 1 | 6163 | Samson | Cockburn | 6,539 | 4,368 | 6,032 | ▲ +49.7% | ▲ +8.4% |
| 2 | 6155 | Canning Vale | Canning | 6,072 | 5,028 | 5,771 | ▲ +20.8% | ▲ +5.2% |
| 3 | 6230 | Carey Park | Bunbury | 6,452 | 5,805 | 4,633 | ▲ +11.1% | ▲ +39.3% |
| 4 | 6164 | Success | Cockburn | 7,665 | 7,197 | 4,782 | ▲ +6.5% | ▲ +60.3% |
| 5 | 6061 | Balga | Stirling | 6,419 | 6,082 | 4,414 | ▲ +5.5% | ▲ +45.4% |
| 6 | 6018 | Innaloo | Stirling | 6,440 | 6,117 | 5,432 | ▲ +5.3% | ▲ +18.6% |
| 7 | 6065 | Wanneroo | Wanneroo | 13,756 | 13,442 | 12,780 | ▲ +2.3% | ▲ +7.6% |
| 8 | 6030 | Merriwa | Wanneroo | 9,422 | 9,307 | 7,531 | ▲ +1.2% | ▲ +25.1% |
| 9 | 6069 | Ellenbrook | Swan | 7,720 | 8,291 | 6,376 | ▼ -6.9% | ▲ +21.1% |
| 10 | 6112 | Armadale | Armadale | 6,316 | 7,170 | 5,339 | ▼ -11.9% | ▲ +18.3% |
Six-month tracker – March to September 2026
| # | Postcode | Suburb | Sep 2025 | Mar 2026 | Jun 2026 | Sep 2026 | 6-month change |
|---|---|---|---|---|---|---|---|
| 1 | 6163 | Samson | 6,032 | 2,389 | 4,368 | 6,539 | ▲ +174% |
| 2 | 6155 | Canning Vale | 5,771 | 2,448 | 5,028 | 6,072 | ▲ +148% |
| 3 | 6112 | Armadale | 5,339 | 4,362 | 7,170 | 6,316 | ▲ +45% |
| 4 | 6164 | Success | 4,782 | 5,878 | 7,197 | 7,665 | ▲ +30% |
| 5 | 6061 | Balga | 4,414 | 4,926 | 6,082 | 6,419 | ▲ +30% |
| 6 | 6065 | Wanneroo | 12,780 | 11,055 | 13,442 | 13,756 | ▲ +24% |
| 7 | 6030 | Merriwa | 7,531 | 7,680 | 9,307 | 9,422 | ▲ +23% |
| 8 | 6069 | Ellenbrook | 6,376 | 6,454 | 8,291 | 7,720 | ▲ +20% |
| 9 | 6018 | Innaloo | 5,432 | 5,804 | 6,117 | 6,440 | ▲ +11% |
| 10 | 6230 | Carey Park | 4,633 | 6,037 | 5,805 | 6,452 | ▲ +7% |
Severe mortgage stress – top 10 WA postcodes
| # | Postcode | Suburb | LGA | Severe now | 3 mos ago | 12 mos ago | Qtr change | Annual change |
|---|---|---|---|---|---|---|---|---|
| 1 | 6153 | Mount Pleasant | Melville | 657 | 311 | – | ▲ +111.3% | n/a* |
| 2 | 6008 | Subiaco | Subiaco | 667 | 421 | – | ▲ +58.4% | n/a* |
| 3 | 6156 | Attadale | Melville | 750 | 551 | 755 | ▲ +36.1% | ▼ -0.7% |
| 4 | 6011 | Cottesloe | Cottesloe | 1,155 | 1,125 | – | ▲ +2.7% | n/a* |
| 5 | 6159 | North Fremantle | Fremantle | 619 | 603 | – | ▲ +2.7% | n/a* |
| 6 | 6010 | Mount Claremont | Nedlands | 2,364 | – | – | n/a* | n/a* |
| 7 | 6014 | Wembley | Cambridge | 1,636 | – | – | n/a* | n/a* |
| 8 | 6015 | City Beach | Cambridge | 1,012 | – | – | n/a* | n/a* |
| 9 | 6026 | Kingsley | Joondalup | 942 | – | – | n/a* | n/a* |
| 10 | 6158 | East Fremantle | East Fremantle | 634 | – | – | n/a* | n/a* |
Ranked by quarterly change. Postcodes with no prior-period reading show n/a*; movements off small bases can be volatile.
South Australia: top 10 mortgage stress postcodes
Adelaide was the steadiest of the big markets. Its top 10 postcodes hold 41,539 stressed households, about 1,400 more than in June: up 3.5% for the quarter and 19.0% for the year. Even so, nine of the ten rose.
Gawler East (5118, Gawler) led, up 23% from 3,373 to 4,154. Mount Barker (5251), in the hills, rose 17% from 3,208 to 3,760.
Paralowie (5108) is the largest hotspot with 7,475 stressed households, up 4% on the quarter. South Plympton (5038) has grown most over 12 months, up 68%.
Yattalunga (Playford) went the other way, falling sharply after a big rise last quarter.
Download the SA edition (PDF) SA data (CSV)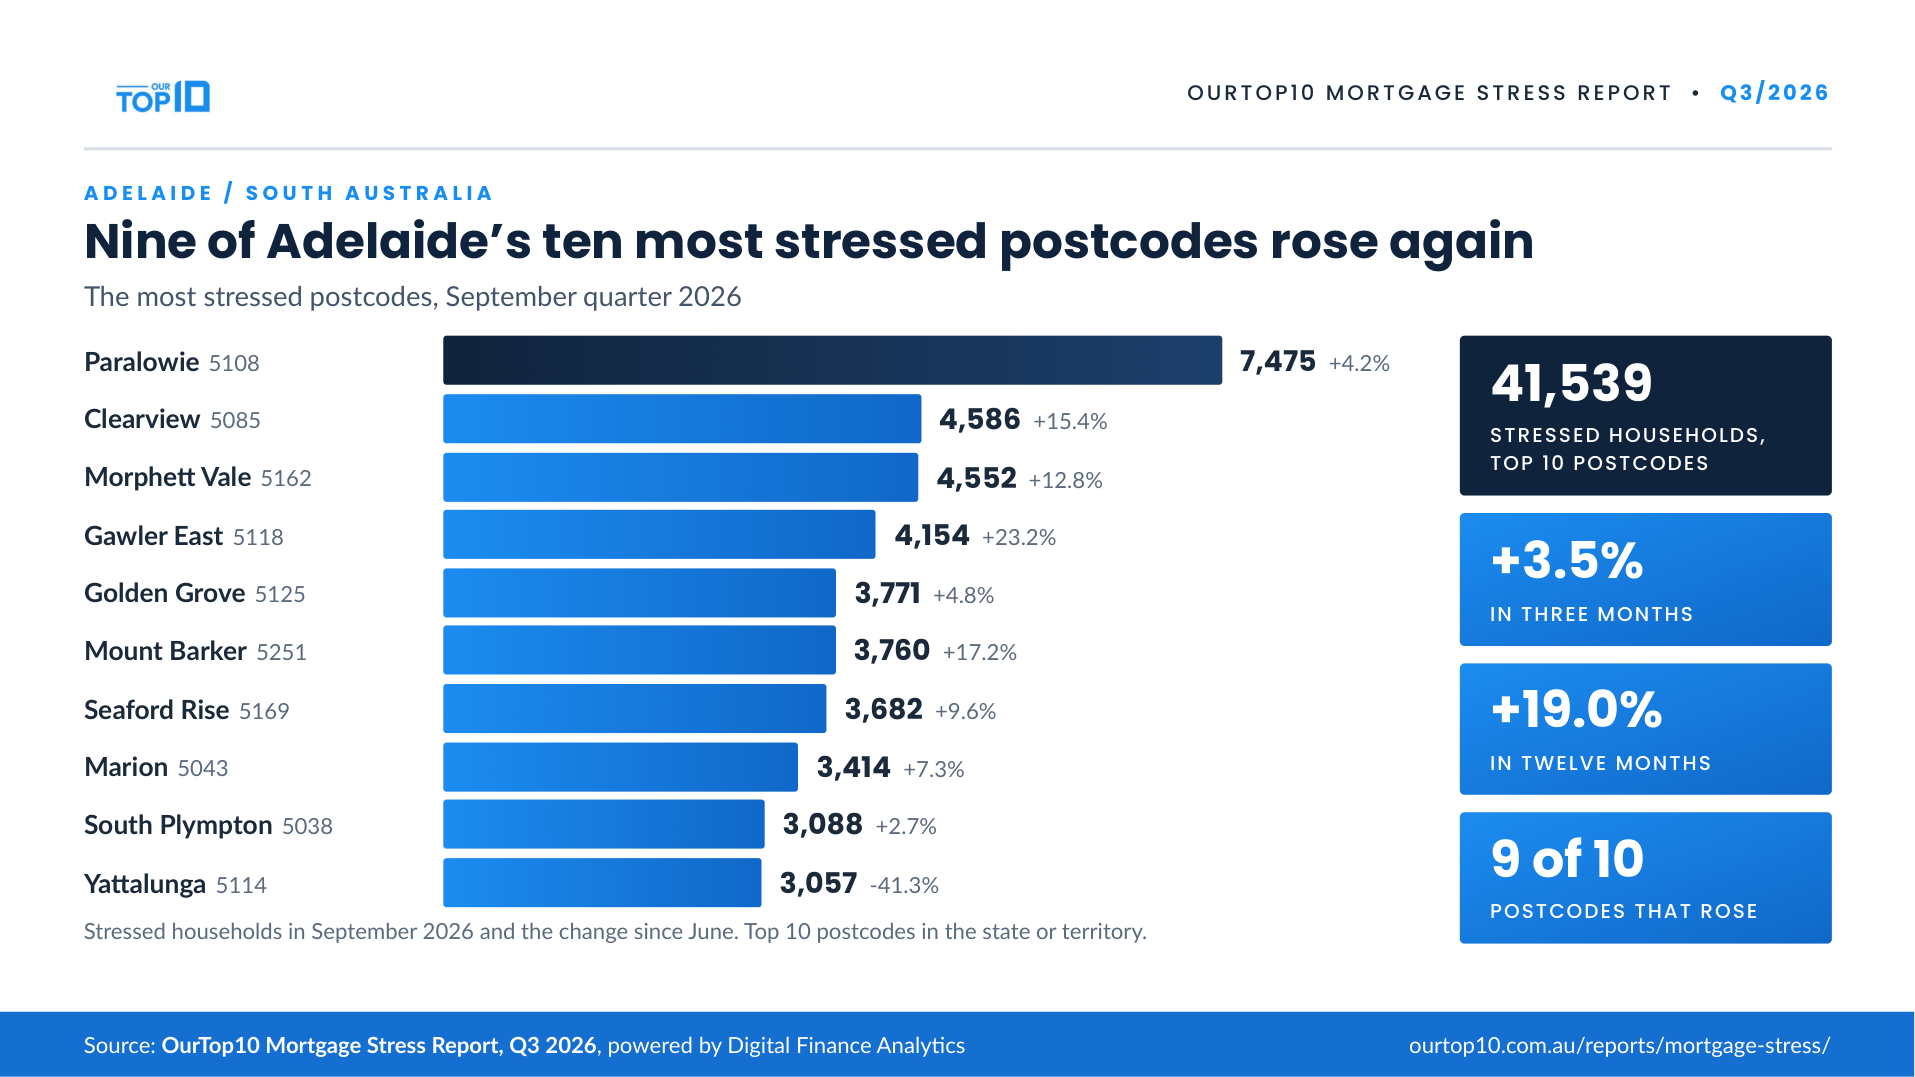
Top 10 SA postcodes – biggest quarterly risers first
| # | Postcode | Suburb | LGA | Stressed now | 3 mos ago | 12 mos ago | Qtr change | Annual change |
|---|---|---|---|---|---|---|---|---|
| 1 | 5118 | Gawler East | Gawler | 4,154 | 3,373 | 2,961 | ▲ +23.2% | ▲ +40.3% |
| 2 | 5251 | Mount Barker | Mount Barker | 3,760 | 3,208 | 3,501 | ▲ +17.2% | ▲ +7.4% |
| 3 | 5085 | Clearview | Port Adelaide Enfield | 4,586 | 3,975 | 3,187 | ▲ +15.4% | ▲ +43.9% |
| 4 | 5162 | Morphett Vale | Onkaparinga | 4,552 | 4,035 | 3,766 | ▲ +12.8% | ▲ +20.9% |
| 5 | 5169 | Seaford Rise | Onkaparinga | 3,682 | 3,360 | 3,229 | ▲ +9.6% | ▲ +14.0% |
| 6 | 5043 | Marion | Marion | 3,414 | 3,181 | 2,535 | ▲ +7.3% | ▲ +34.7% |
| 7 | 5125 | Golden Grove | Tea Tree Gully | 3,771 | 3,597 | 3,091 | ▲ +4.8% | ▲ +22.0% |
| 8 | 5108 | Paralowie | Salisbury | 7,475 | 7,173 | 6,204 | ▲ +4.2% | ▲ +20.5% |
| 9 | 5038 | South Plympton | Marion | 3,088 | 3,008 | 1,834 | ▲ +2.7% | ▲ +68.4% |
| 10 | 5114 | Yattalunga | Playford | 3,057 | 5,211 | 4,613 | ▼ -41.3% | ▼ -33.7% |
Six-month tracker – March to September 2026
| # | Postcode | Suburb | Sep 2025 | Mar 2026 | Jun 2026 | Sep 2026 | 6-month change |
|---|---|---|---|---|---|---|---|
| 1 | 5125 | Golden Grove | 3,091 | 2,802 | 3,597 | 3,771 | ▲ +35% |
| 2 | 5251 | Mount Barker | 3,501 | 2,868 | 3,208 | 3,760 | ▲ +31% |
| 3 | 5085 | Clearview | 3,187 | 3,583 | 3,975 | 4,586 | ▲ +28% |
| 4 | 5169 | Seaford Rise | 3,229 | 2,894 | 3,360 | 3,682 | ▲ +27% |
| 5 | 5108 | Paralowie | 6,204 | 6,424 | 7,173 | 7,475 | ▲ +16% |
| 6 | 5162 | Morphett Vale | 3,766 | 4,083 | 4,035 | 4,552 | ▲ +11% |
| 7 | 5118 | Gawler East | 2,961 | 3,794 | 3,373 | 4,154 | ▲ +9% |
| 8 | 5038 | South Plympton | 1,834 | 2,821 | 3,008 | 3,088 | ▲ +9% |
| 9 | 5114 | Yattalunga | 4,613 | 3,696 | 5,211 | 3,057 | ▼ -17% |
| 10 | 5043 | Marion | 2,535 | – | 3,181 | 3,414 | n/a* |
Tasmania: top 7 mortgage stress postcodes
All seven ranked Tasmanian postcodes rose, the only market where that happened. Together they hold 22,646 stressed households, around 2,700 more than in June. The 13.7% quarterly rise is the fastest of any market, and the annual rise is 21.1%.
Youngtown (7249), in Launceston, rose 30% from 1,669 to 2,163 and is up 62% over the year, the strongest annual growth in the state. Riverside (7250) rose 25%, from 5,978 to 7,446.
Riverside is also the state’s largest hotspot, so Launceston carries the biggest numbers this quarter.
Five postcodes ranked in June, including Kingston (7050), did not appear in the September sample, so the list is not a like-for-like match with last quarter.
Download the TAS edition (PDF) TAS data (CSV)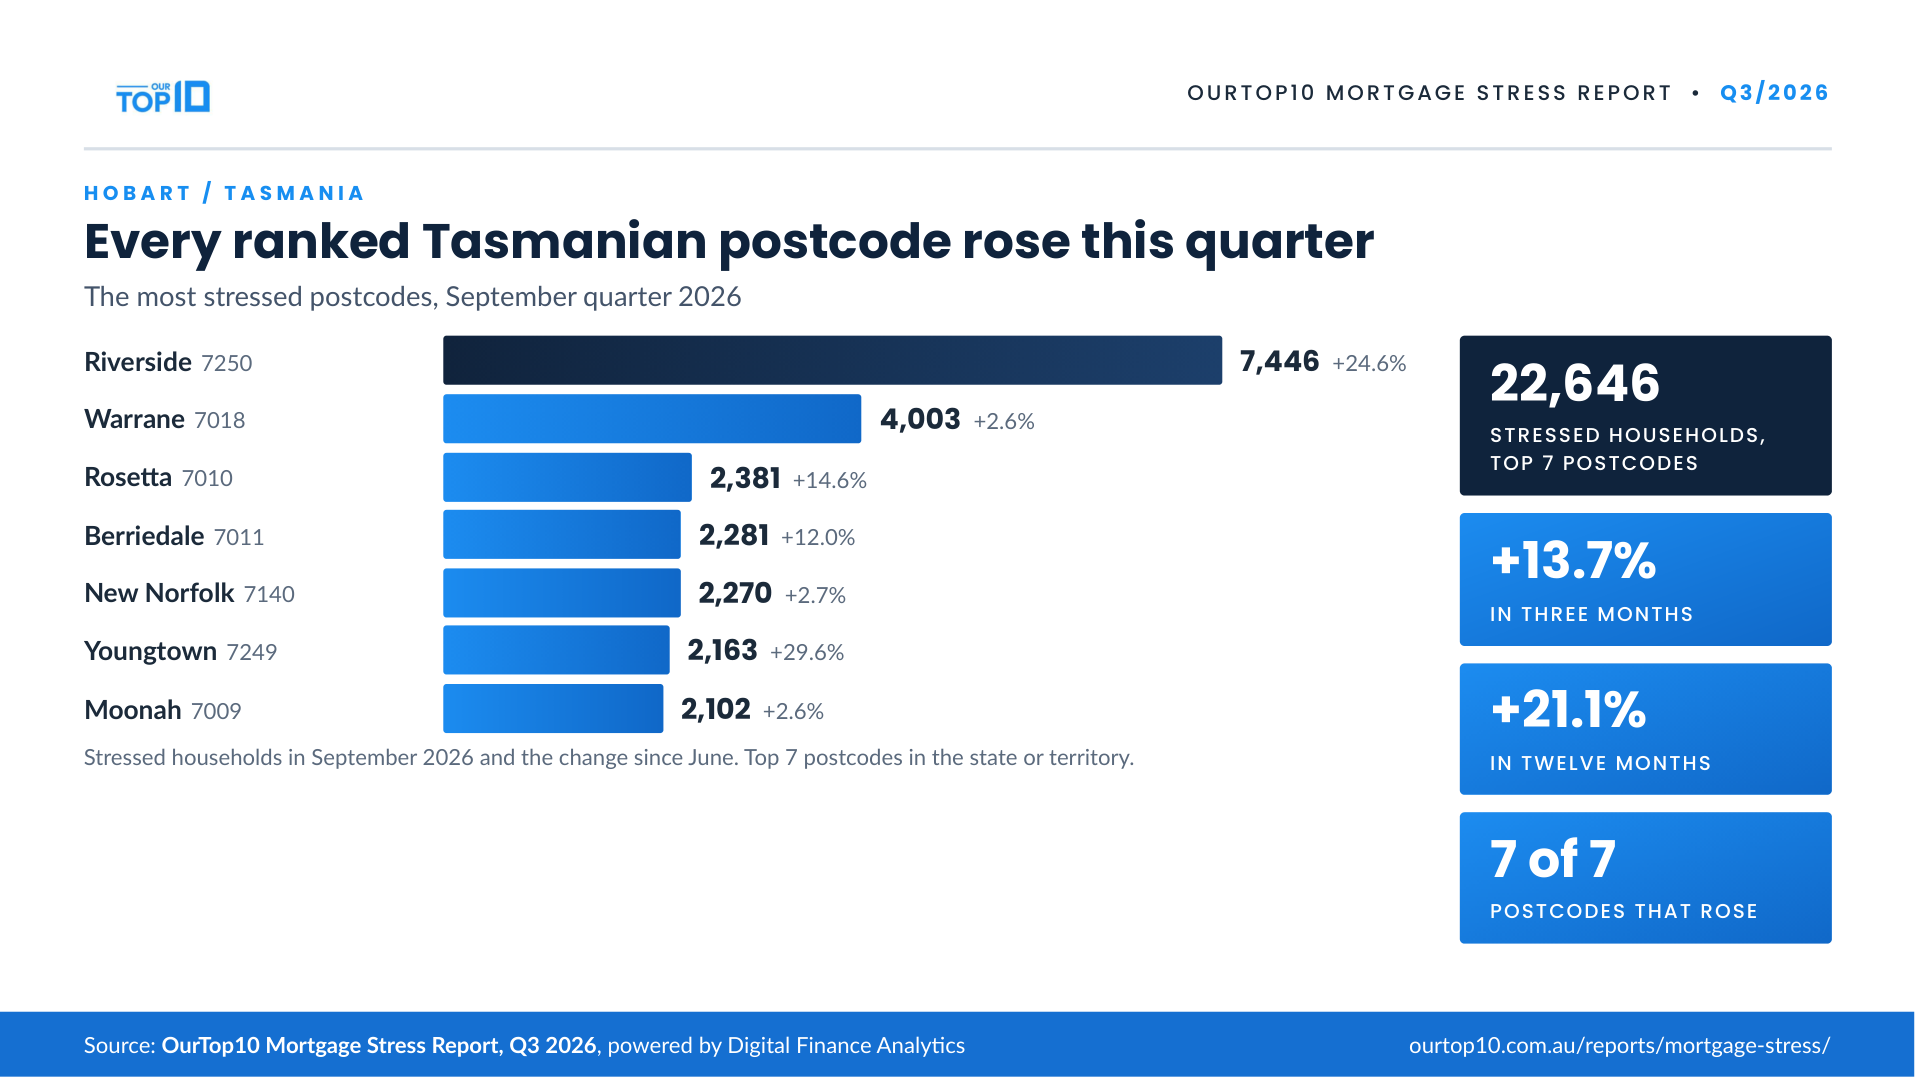
Top 7 TAS postcodes – biggest quarterly risers first
| # | Postcode | Suburb | LGA | Stressed now | 3 mos ago | 12 mos ago | Qtr change | Annual change |
|---|---|---|---|---|---|---|---|---|
| 1 | 7249 | Youngtown | Launceston | 2,163 | 1,669 | 1,335 | ▲ +29.6% | ▲ +62.0% |
| 2 | 7250 | Riverside | Launceston | 7,446 | 5,978 | 6,379 | ▲ +24.6% | ▲ +16.7% |
| 3 | 7010 | Rosetta | Glenorchy | 2,381 | 2,078 | 1,587 | ▲ +14.6% | ▲ +50.0% |
| 4 | 7011 | Berriedale | Glenorchy | 2,281 | 2,037 | 1,997 | ▲ +12.0% | ▲ +14.2% |
| 5 | 7140 | New Norfolk | Derwent Valley | 2,270 | 2,211 | 2,023 | ▲ +2.7% | ▲ +12.2% |
| 6 | 7018 | Warrane | Clarence | 4,003 | 3,900 | 3,567 | ▲ +2.6% | ▲ +12.2% |
| 7 | 7009 | Moonah | Glenorchy | 2,102 | 2,048 | 1,806 | ▲ +2.6% | ▲ +16.4% |
Percentage movements in smaller postcodes can be volatile quarter-to-quarter because of smaller household bases. The September extract lists seven distinct Tasmanian postcodes (three entries were repeated in the source data), so Tasmania’s figures cover seven ranked postcodes rather than ten.
Six-month tracker – March to September 2026
| # | Postcode | Suburb | Sep 2025 | Mar 2026 | Jun 2026 | Sep 2026 | 6-month change |
|---|---|---|---|---|---|---|---|
| 1 | 7140 | New Norfolk | 2,023 | 1,659 | 2,211 | 2,270 | ▲ +37% |
| 2 | 7011 | Berriedale | 1,997 | 1,860 | 2,037 | 2,281 | ▲ +23% |
| 3 | 7249 | Youngtown | 1,335 | 1,795 | 1,669 | 2,163 | ▲ +21% |
| 4 | 7010 | Rosetta | 1,587 | 1,976 | 2,078 | 2,381 | ▲ +20% |
| 5 | 7009 | Moonah | 1,806 | 1,802 | 2,048 | 2,102 | ▲ +17% |
| 6 | 7018 | Warrane | 3,567 | 3,657 | 3,900 | 4,003 | ▲ +9% |
| 7 | 7250 | Riverside | 6,379 | – | 5,978 | 7,446 | n/a* |
Australian Capital Territory: top 10 mortgage stress postcodes
The ACT’s top 10 postcodes hold 25,151 stressed households, about 1,400 more than in June. That is a 5.8% rise for the quarter and 18.2% for the year. Eight of the ten rose.
Macquarie (2614), in the inner north, moved fastest. It went from 916 to 1,679 stressed households in three months, an 83% rise, and is up 84% over the year.
Amaroo (2914) is the territory’s largest hotspot with 5,531 stressed households, up 5% on the quarter. Weston (2611) bounced back 27%, from 2,510 to 3,192, after falling sharply last quarter.
Stress is still concentrated in Gungahlin and Tuggeranong.
Download the ACT edition (PDF) ACT data (CSV)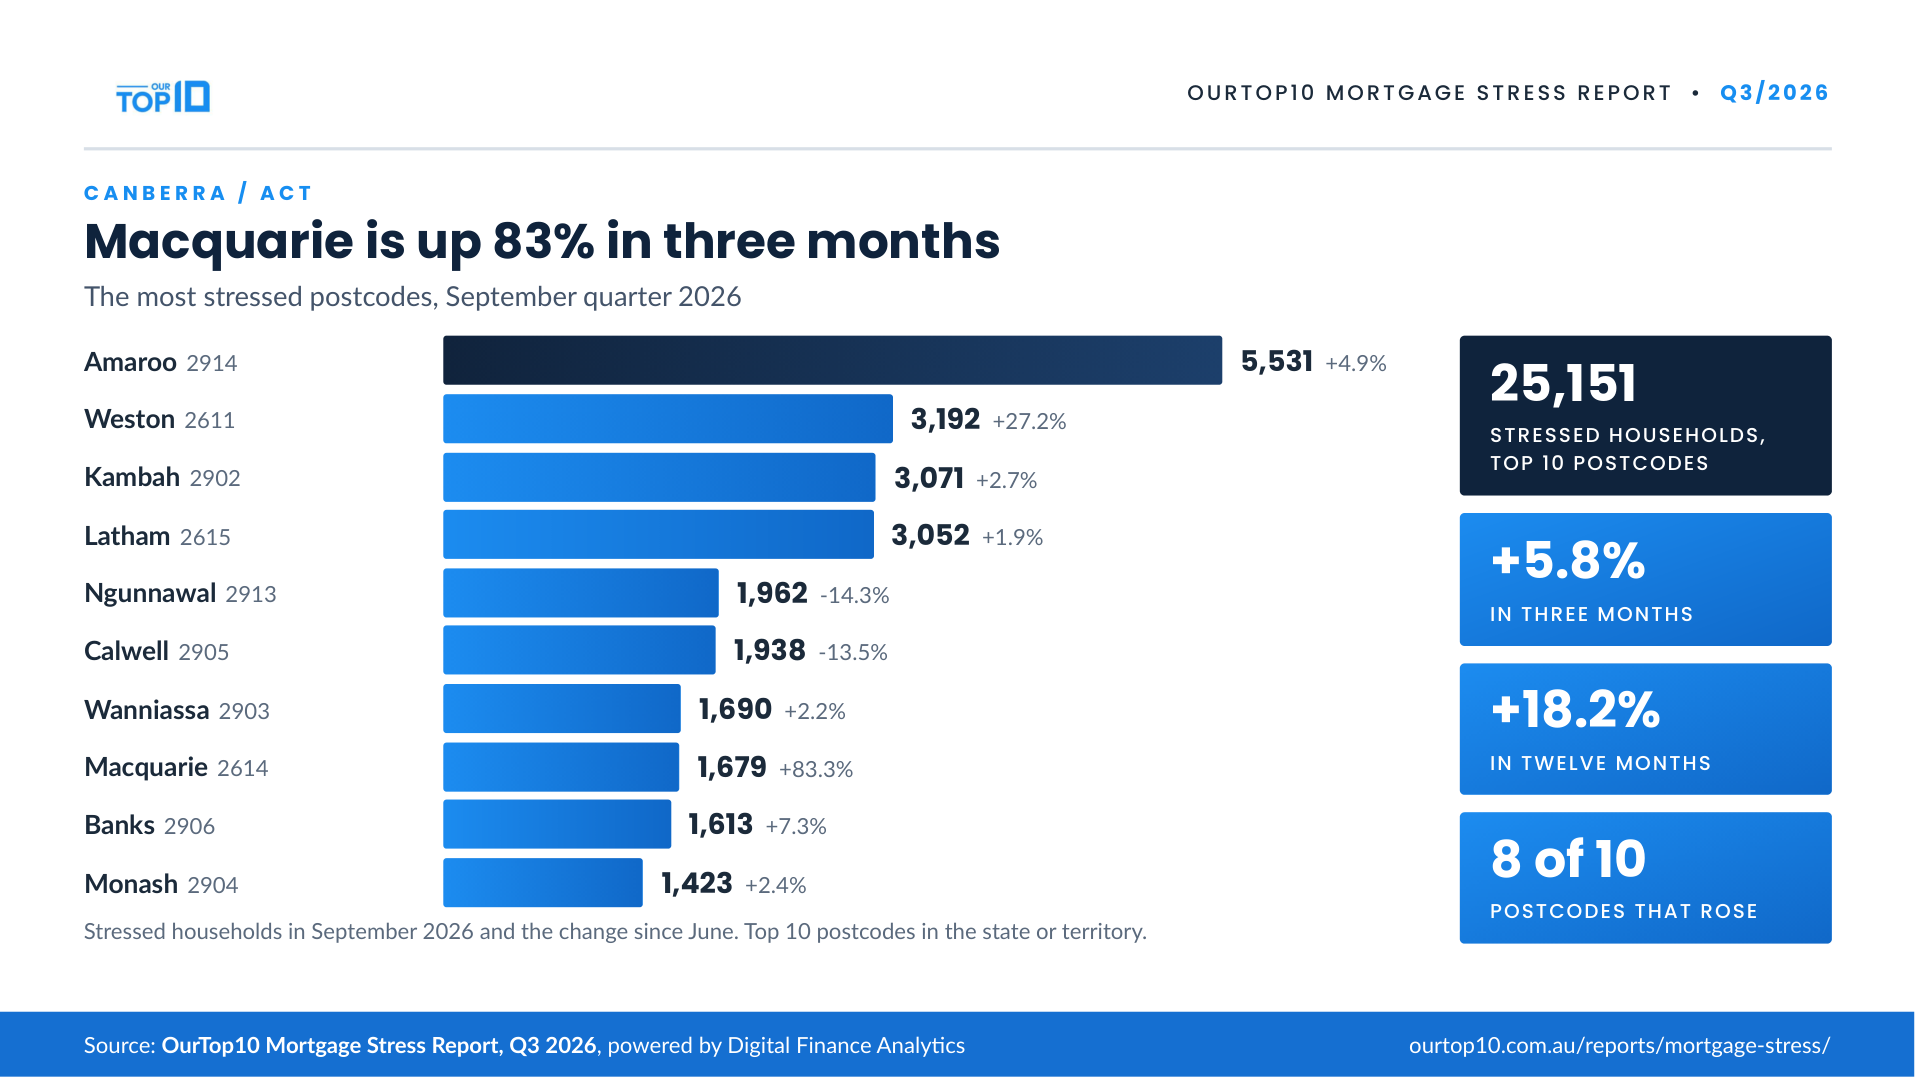
Top 10 ACT postcodes – biggest quarterly risers first
| # | Postcode | Suburb | LGA | Stressed now | 3 mos ago | 12 mos ago | Qtr change | Annual change |
|---|---|---|---|---|---|---|---|---|
| 1 | 2614 | Macquarie | Canberra | 1,679 | 916 | 911 | ▲ +83.3% | ▲ +84.3% |
| 2 | 2611 | Weston | Canberra | 3,192 | 2,510 | 2,769 | ▲ +27.2% | ▲ +15.3% |
| 3 | 2906 | Banks | Canberra | 1,613 | 1,503 | 1,167 | ▲ +7.3% | ▲ +38.2% |
| 4 | 2914 | Amaroo | Canberra | 5,531 | 5,275 | 5,040 | ▲ +4.9% | ▲ +9.7% |
| 5 | 2902 | Kambah | Canberra | 3,071 | 2,991 | 2,736 | ▲ +2.7% | ▲ +12.2% |
| 6 | 2904 | Monash | Canberra | 1,423 | 1,389 | 986 | ▲ +2.4% | ▲ +44.3% |
| 7 | 2903 | Wanniassa | Canberra | 1,690 | 1,654 | 1,381 | ▲ +2.2% | ▲ +22.4% |
| 8 | 2615 | Latham | Canberra | 3,052 | 2,994 | 3,043 | ▲ +1.9% | ▲ +0.3% |
| 9 | 2905 | Calwell | Canberra | 1,938 | 2,241 | 1,174 | ▼ -13.5% | ▲ +65.1% |
| 10 | 2913 | Ngunnawal | Canberra | 1,962 | 2,290 | 2,074 | ▼ -14.3% | ▼ -5.4% |
Six-month tracker – March to September 2026
| # | Postcode | Suburb | Sep 2025 | Mar 2026 | Jun 2026 | Sep 2026 | 6-month change |
|---|---|---|---|---|---|---|---|
| 1 | 2904 | Monash | 986 | 1,014 | 1,389 | 1,423 | ▲ +40% |
| 2 | 2614 | Macquarie | 911 | 1,263 | 916 | 1,679 | ▲ +33% |
| 3 | 2903 | Wanniassa | 1,381 | 1,359 | 1,654 | 1,690 | ▲ +24% |
| 4 | 2914 | Amaroo | 5,040 | 4,696 | 5,275 | 5,531 | ▲ +18% |
| 5 | 2902 | Kambah | 2,736 | 2,805 | 2,991 | 3,071 | ▲ +9% |
| 6 | 2615 | Latham | 3,043 | 2,839 | 2,994 | 3,052 | ▲ +8% |
| 7 | 2913 | Ngunnawal | 2,074 | 1,843 | 2,290 | 1,962 | ▲ +6% |
| 8 | 2905 | Calwell | 1,174 | 1,836 | 2,241 | 1,938 | ▲ +6% |
| 9 | 2906 | Banks | 1,167 | 1,561 | 1,503 | 1,613 | ▲ +3% |
| 10 | 2611 | Weston | 2,769 | 3,922 | 2,510 | 3,192 | ▼ -19% |
Local editions
Six local cuts of the September data for suburban and regional papers. Jump to Yarra Ranges, Fremantle and surrounds, The Hills Shire and Hawkesbury, Limestone Coast, Fleurieu Peninsula and southern Onkaparinga, Greater Perth.
Yarra Ranges: local edition
11,733 households are in mortgage stress across the ten Yarra Ranges postcodes with the most stressed households. That is 364 more than in June and 1,976 more than a year ago.
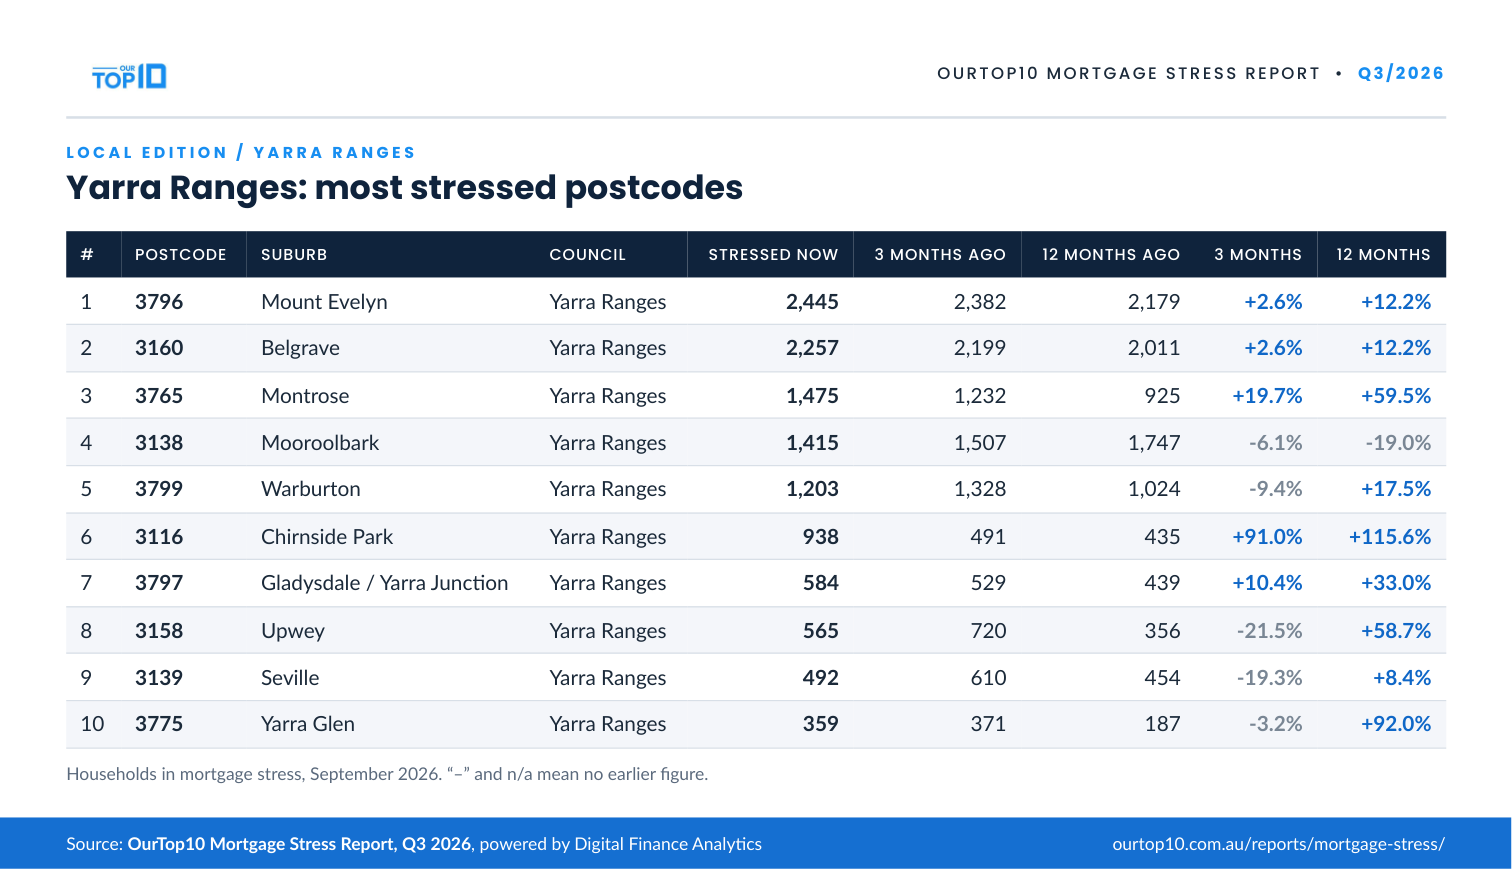
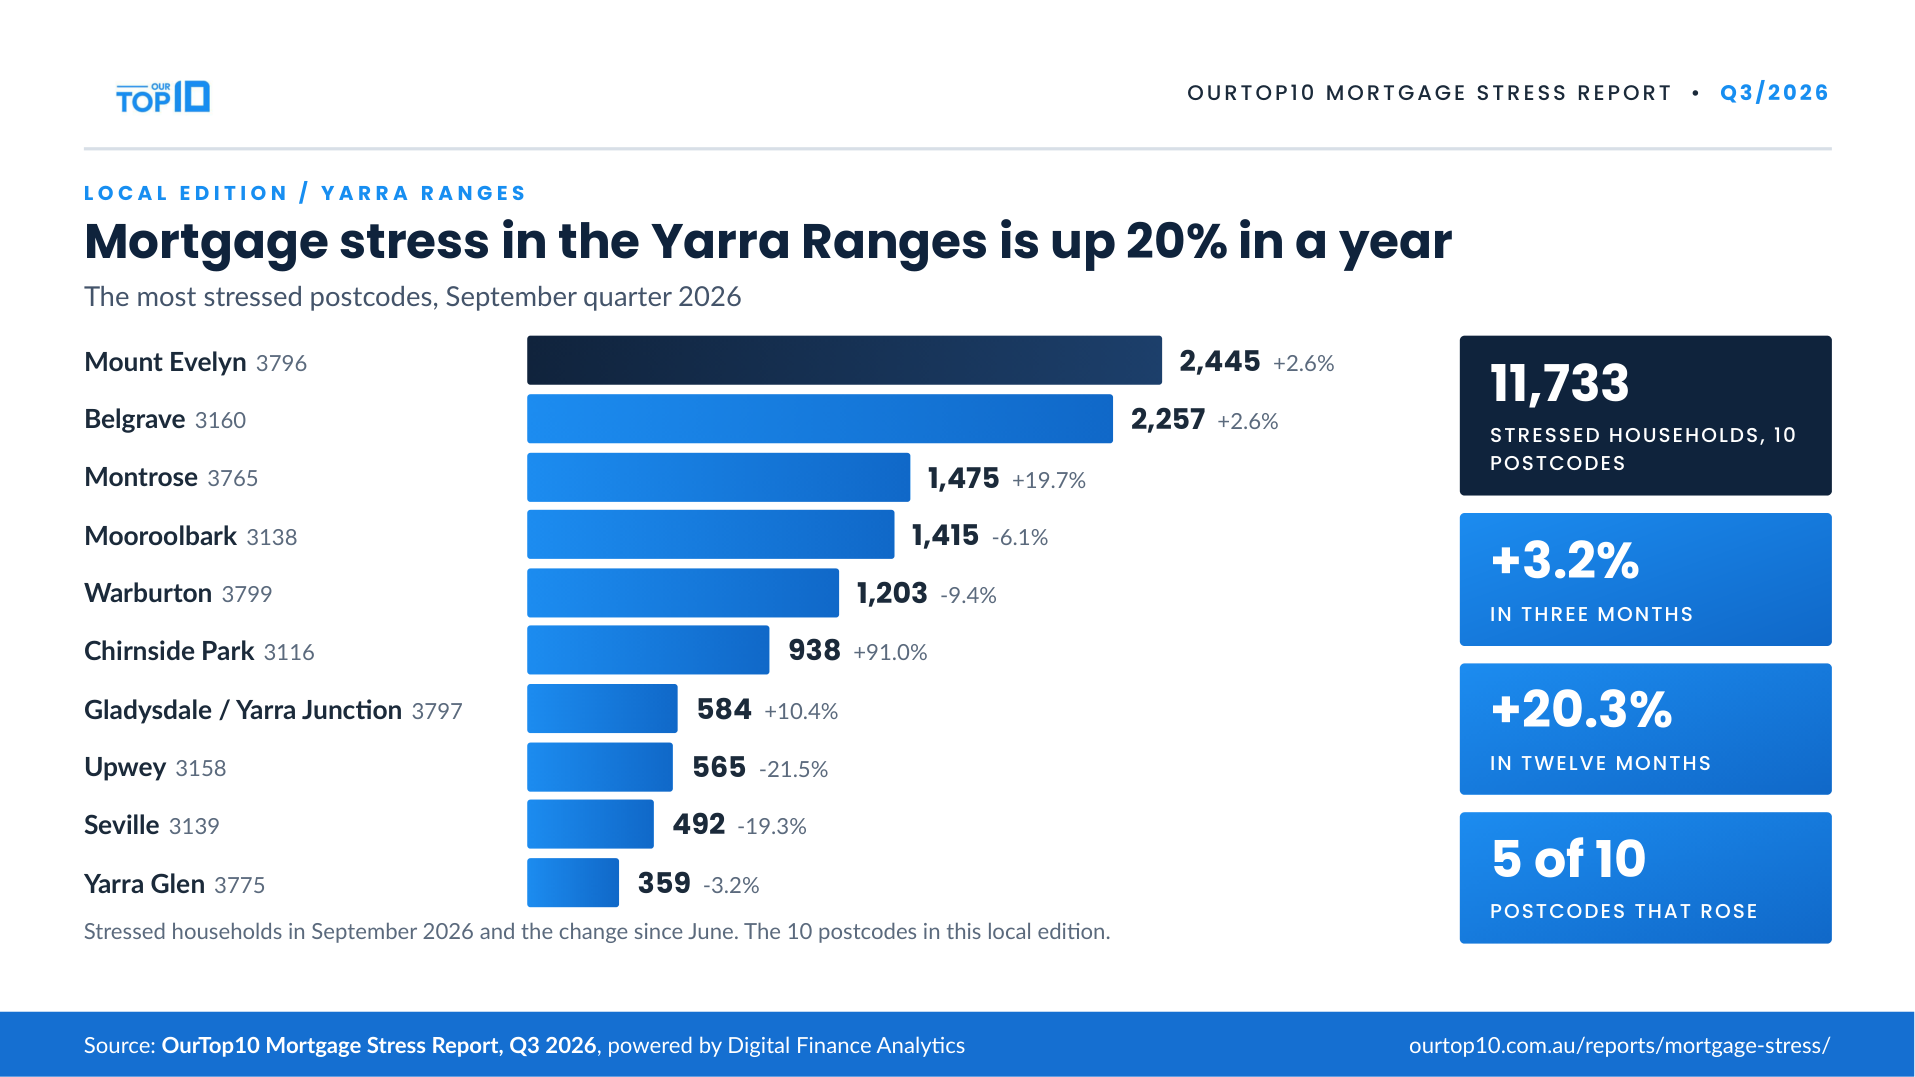
Free to publish with credit to the OurTop10 Mortgage Stress Report. Click the picture for the full-size file.
Yarra Ranges – most stressed postcodes
| # | Postcode | Suburb | Council | Stressed now | 3 mos ago | 12 mos ago | Qtr change | Annual change |
|---|---|---|---|---|---|---|---|---|
| 1 | 3796 | Mount Evelyn | Yarra Ranges | 2,445 | 2,382 | 2,179 | ▲ +2.6% | ▲ +12.2% |
| 2 | 3160 | Belgrave | Yarra Ranges | 2,257 | 2,199 | 2,011 | ▲ +2.6% | ▲ +12.2% |
| 3 | 3765 | Montrose | Yarra Ranges | 1,475 | 1,232 | 925 | ▲ +19.7% | ▲ +59.5% |
| 4 | 3138 | Mooroolbark | Yarra Ranges | 1,415 | 1,507 | 1,747 | ▼ -6.1% | ▼ -19.0% |
| 5 | 3799 | Warburton | Yarra Ranges | 1,203 | 1,328 | 1,024 | ▼ -9.4% | ▲ +17.5% |
| 6 | 3116 | Chirnside Park | Yarra Ranges | 938 | 491 | 435 | ▲ +91.0% | ▲ +115.6% |
| 7 | 3797 | Gladysdale / Yarra Junction | Yarra Ranges | 584 | 529 | 439 | ▲ +10.4% | ▲ +33.0% |
| 8 | 3158 | Upwey | Yarra Ranges | 565 | 720 | 356 | ▼ -21.5% | ▲ +58.7% |
| 9 | 3139 | Seville | Yarra Ranges | 492 | 610 | 454 | ▼ -19.3% | ▲ +8.4% |
| 10 | 3775 | Yarra Glen | Yarra Ranges | 359 | 371 | 187 | ▼ -3.2% | ▲ +92.0% |
Ranked by households in mortgage stress, September 2026. Changes compare postcodes that have a figure in both periods; n/a* means no earlier figure. Small postcodes have small survey samples, so their numbers swing more. Figures are scaled up from a survey of about 4,500 households a month, so a suburb with no survey responses this quarter is not listed.
“To explain, it is quite possible for all households in a particular suburb to have cash flow stress, as they cut back on living expense, things like dental treatment, school fees, or insurance, to prioritise their mortgage payments.”
“The Yarra Ranges has close to 2,000 more households in mortgage stress than a year ago. In Mount Evelyn and Belgrave every borrowing household is now counted as stressed. These are families whose bills outrun their income every month.”
Fremantle and surrounds: local edition
17,829 households are in mortgage stress across six postcodes in and around Fremantle, up 13.5% in three months and 26.8% in a year. Almost all of the rise came from the Cockburn side.
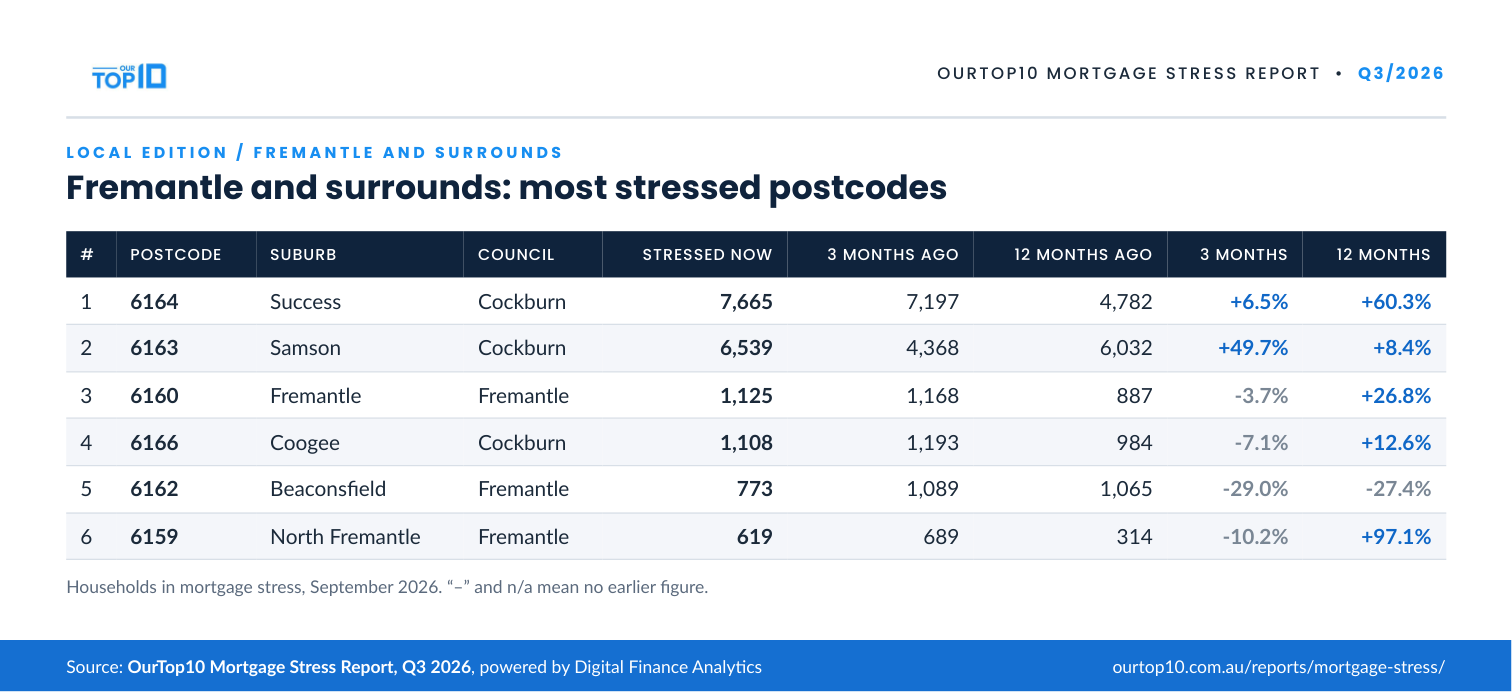
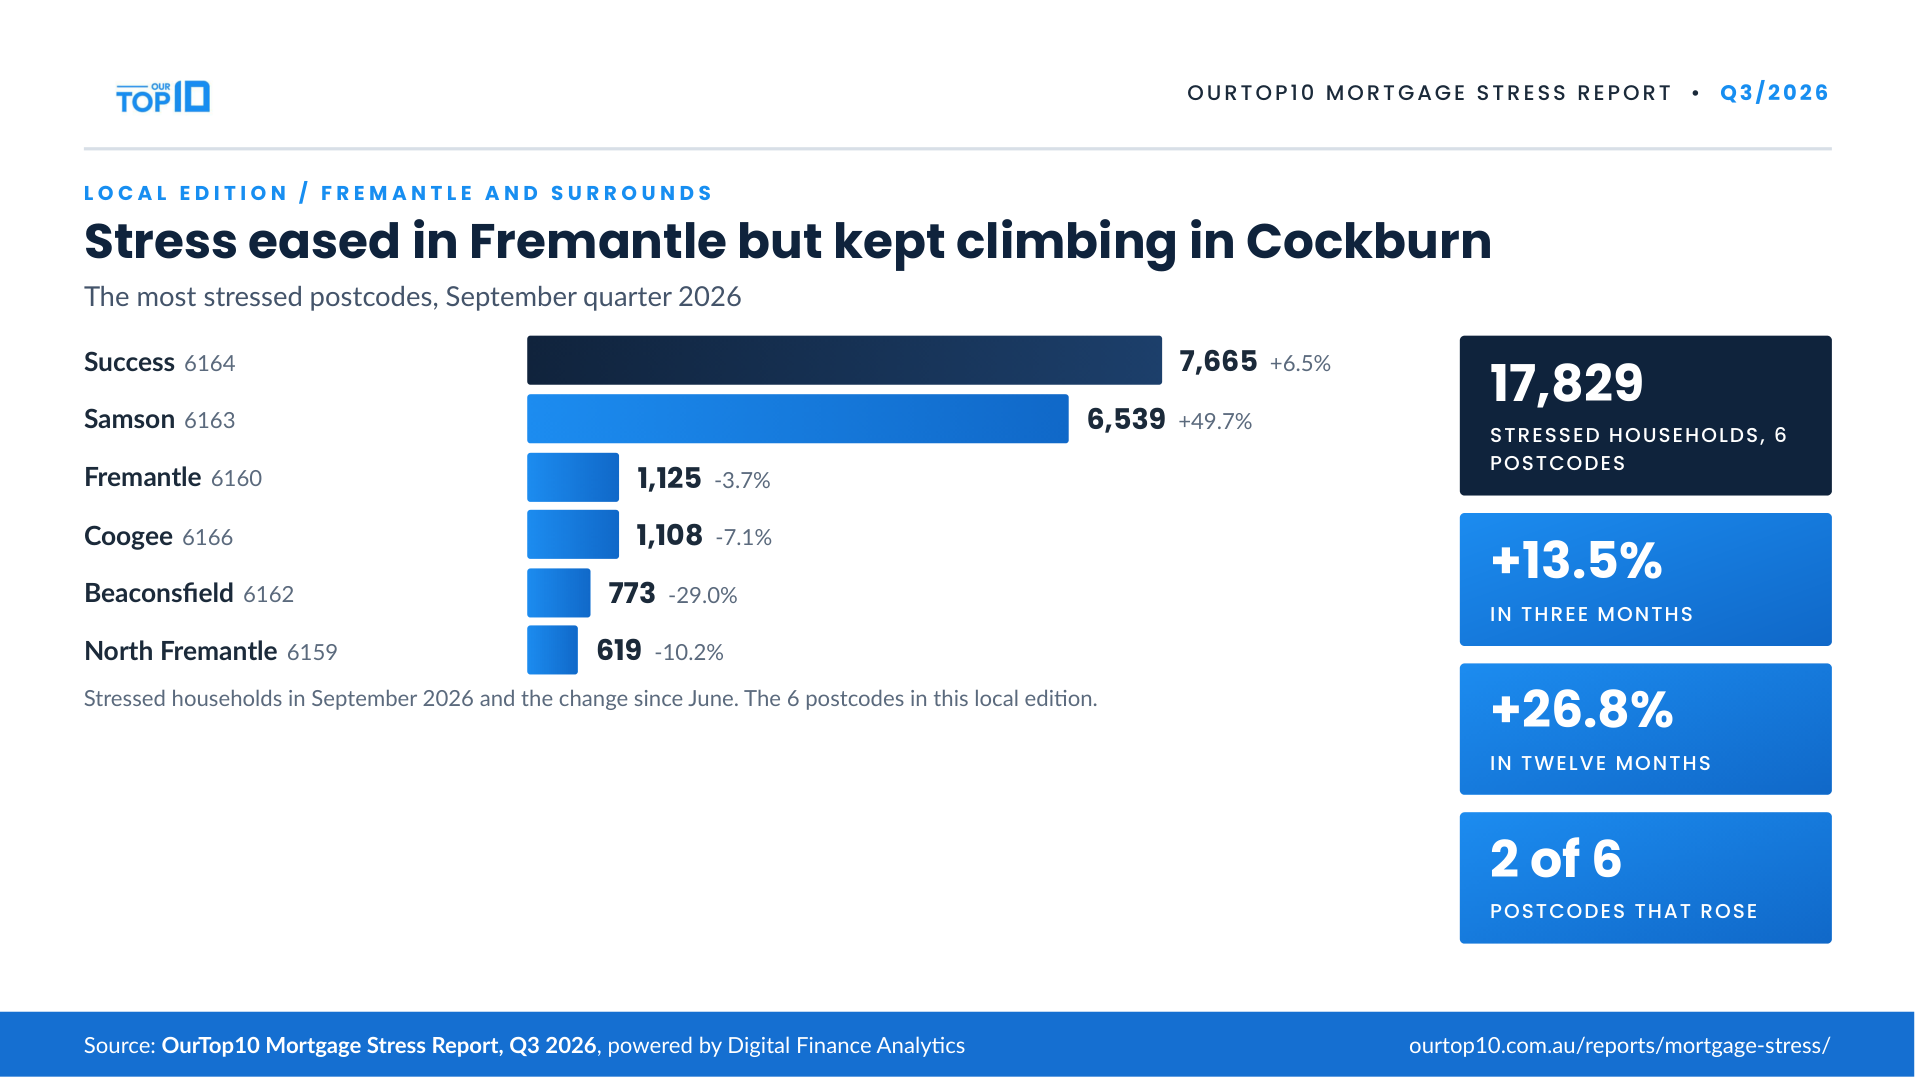
Free to publish with credit to the OurTop10 Mortgage Stress Report. Click the picture for the full-size file.
Fremantle and surrounds – most stressed postcodes
| # | Postcode | Suburb | Council | Stressed now | 3 mos ago | 12 mos ago | Qtr change | Annual change |
|---|---|---|---|---|---|---|---|---|
| 1 | 6164 | Success | Cockburn | 7,665 | 7,197 | 4,782 | ▲ +6.5% | ▲ +60.3% |
| 2 | 6163 | Samson | Cockburn | 6,539 | 4,368 | 6,032 | ▲ +49.7% | ▲ +8.4% |
| 3 | 6160 | Fremantle | Fremantle | 1,125 | 1,168 | 887 | ▼ -3.7% | ▲ +26.8% |
| 4 | 6166 | Coogee | Cockburn | 1,108 | 1,193 | 984 | ▼ -7.1% | ▲ +12.6% |
| 5 | 6162 | Beaconsfield | Fremantle | 773 | 1,089 | 1,065 | ▼ -29.0% | ▼ -27.4% |
| 6 | 6159 | North Fremantle | Fremantle | 619 | 689 | 314 | ▼ -10.2% | ▲ +97.1% |
Ranked by households in mortgage stress, September 2026. Changes compare postcodes that have a figure in both periods; n/a* means no earlier figure. Figures are scaled up from a survey of about 4,500 households a month, so a suburb with no survey responses this quarter is not listed.
Severe mortgage stress: North Fremantle (6159) 619, from 603 three months ago; Fremantle (6160) 535, from 561 three months ago.
“Next time, we expect stress to go higher still and continue to spread. We are at a tipping point.”
“Fremantle itself eased this quarter, but next door in Cockburn the numbers kept climbing. Success alone has 7,665 households in mortgage stress, 60% more than a year ago.”
The Hills Shire and Hawkesbury: local edition
29,395 households are in mortgage stress across the ten most stressed postcodes in the Hills and Hawkesbury. The total slipped 2.1% this quarter but is 9.1% higher than a year ago.
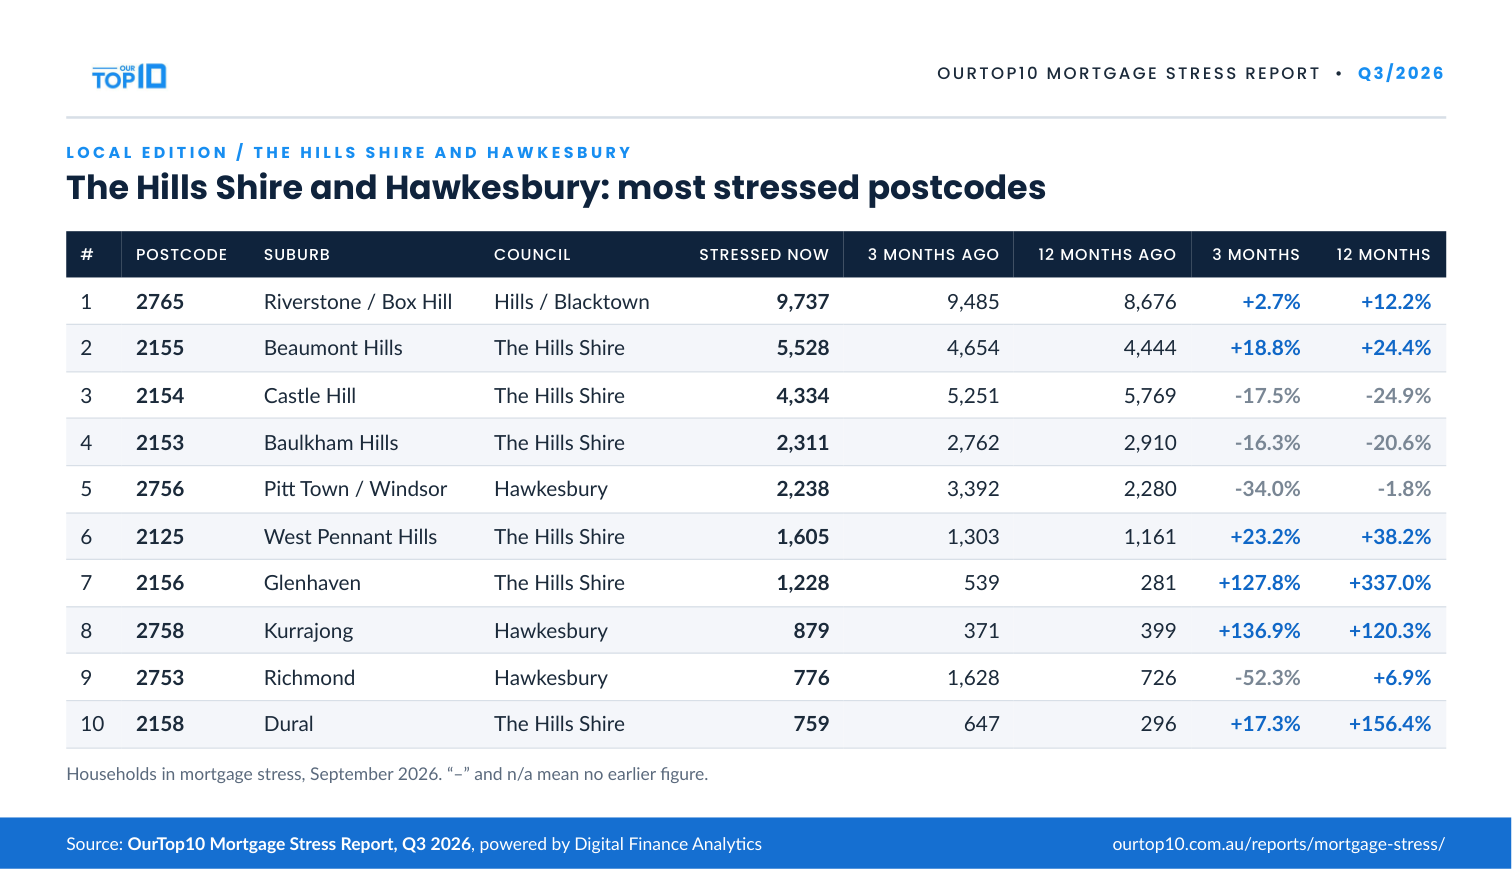
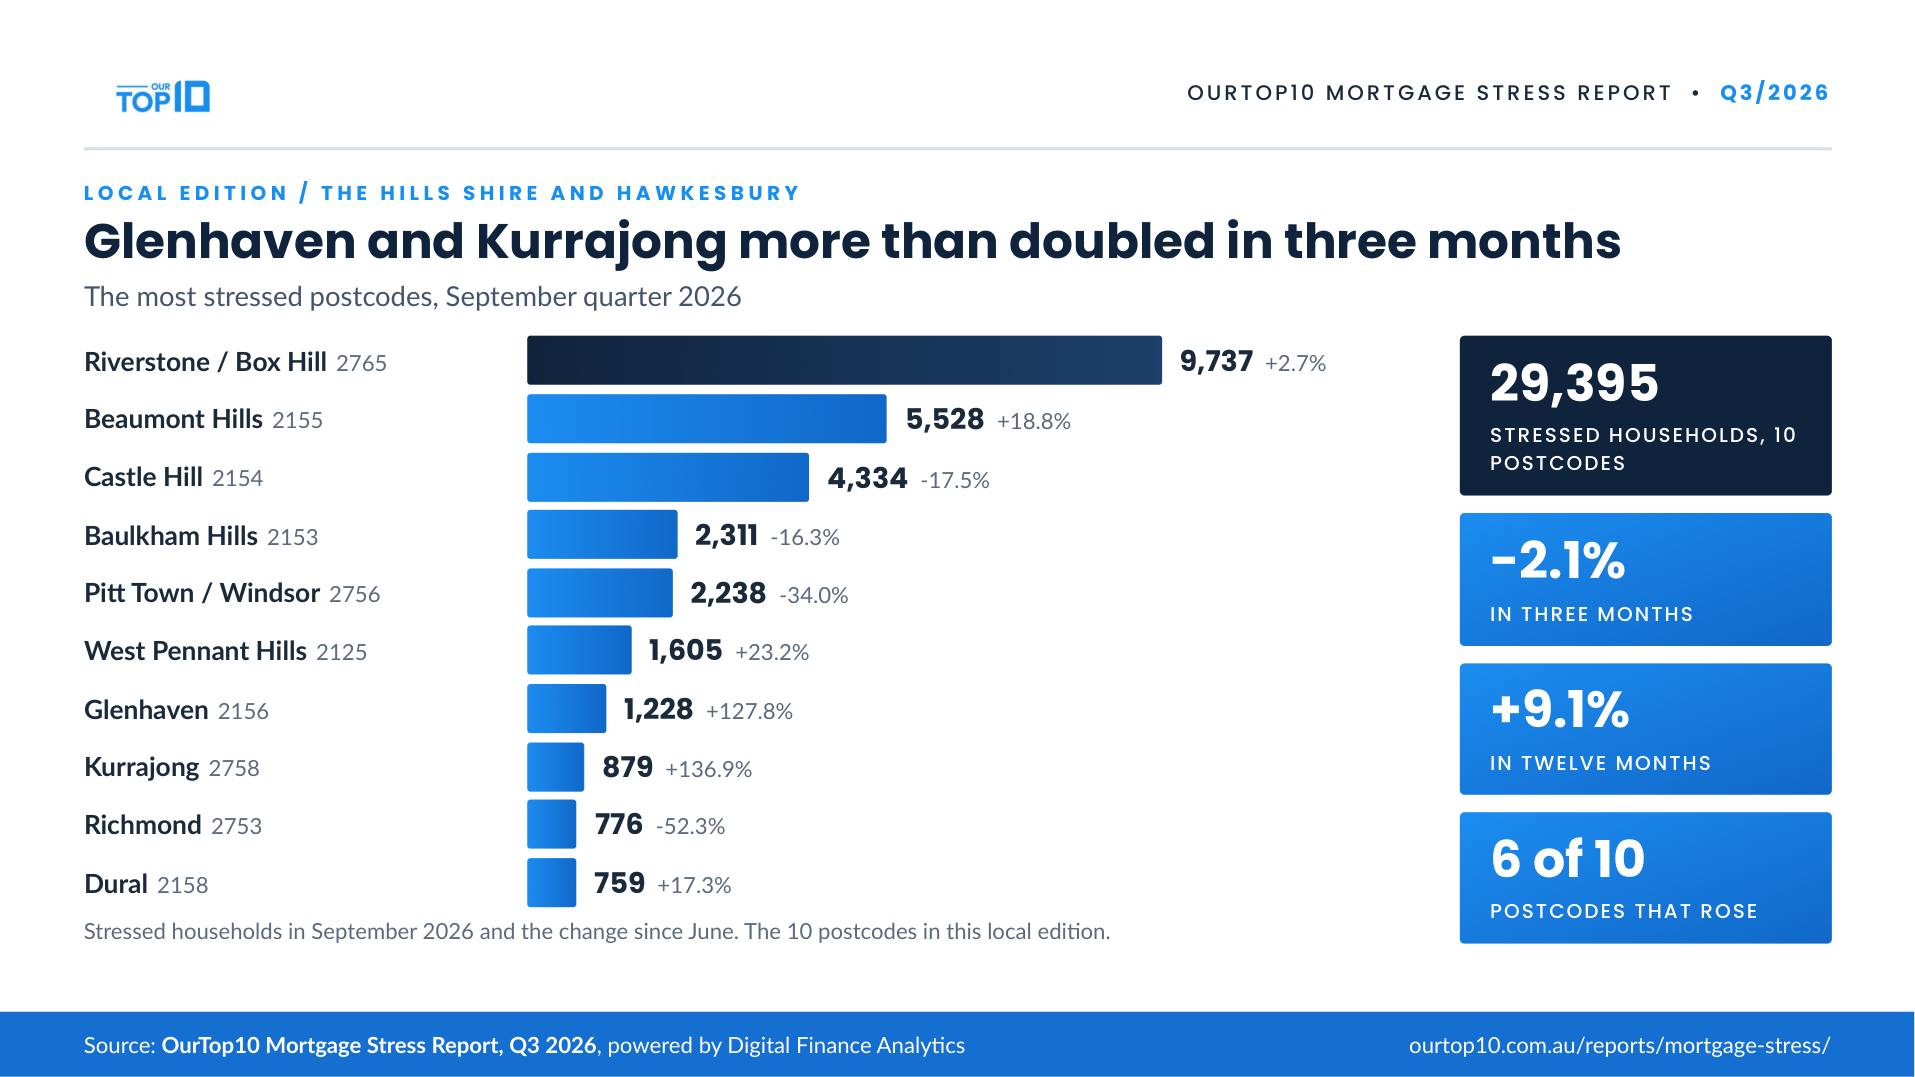
Free to publish with credit to the OurTop10 Mortgage Stress Report. Click the picture for the full-size file.
The Hills Shire and Hawkesbury – most stressed postcodes
| # | Postcode | Suburb | Council | Stressed now | 3 mos ago | 12 mos ago | Qtr change | Annual change |
|---|---|---|---|---|---|---|---|---|
| 1 | 2765 | Riverstone / Box Hill | Hills / Blacktown | 9,737 | 9,485 | 8,676 | ▲ +2.7% | ▲ +12.2% |
| 2 | 2155 | Beaumont Hills | The Hills Shire | 5,528 | 4,654 | 4,444 | ▲ +18.8% | ▲ +24.4% |
| 3 | 2154 | Castle Hill | The Hills Shire | 4,334 | 5,251 | 5,769 | ▼ -17.5% | ▼ -24.9% |
| 4 | 2153 | Baulkham Hills | The Hills Shire | 2,311 | 2,762 | 2,910 | ▼ -16.3% | ▼ -20.6% |
| 5 | 2756 | Pitt Town / Windsor | Hawkesbury | 2,238 | 3,392 | 2,280 | ▼ -34.0% | ▼ -1.8% |
| 6 | 2125 | West Pennant Hills | The Hills Shire | 1,605 | 1,303 | 1,161 | ▲ +23.2% | ▲ +38.2% |
| 7 | 2156 | Glenhaven | The Hills Shire | 1,228 | 539 | 281 | ▲ +127.8% | ▲ +337.0% |
| 8 | 2758 | Kurrajong | Hawkesbury | 879 | 371 | 399 | ▲ +136.9% | ▲ +120.3% |
| 9 | 2753 | Richmond | Hawkesbury | 776 | 1,628 | 726 | ▼ -52.3% | ▲ +6.9% |
| 10 | 2158 | Dural | The Hills Shire | 759 | 647 | 296 | ▲ +17.3% | ▲ +156.4% |
Ranked by households in mortgage stress, September 2026. Changes compare postcodes that have a figure in both periods; n/a* means no earlier figure. Small postcodes have small survey samples, so their numbers swing more. Figures are scaled up from a survey of about 4,500 households a month, so a suburb with no survey responses this quarter is not listed.
Severe mortgage stress: Baulkham Hills (2153) 1,022, from 564 three months ago; Beaumont Hills (2155) 645, from 1,496 three months ago; West Pennant Hills (2125) 555, from 442 three months ago.
“Stress is spreading into more wealthy areas, who in theory have more buffers and options, but in practice have bigger living expenses, and bigger mortgages to match their bigger incomes.”
“People think of the Hills and the Hawkesbury as comfortable, but Glenhaven and Kurrajong both more than doubled in three months. A big income does not help much when the mortgage and the bills are bigger again.”
Limestone Coast: local edition
3,461 households are in mortgage stress across seven Limestone Coast postcodes. Mount Gambier (5290) accounts for almost half of them and is up 6.8% in three months.
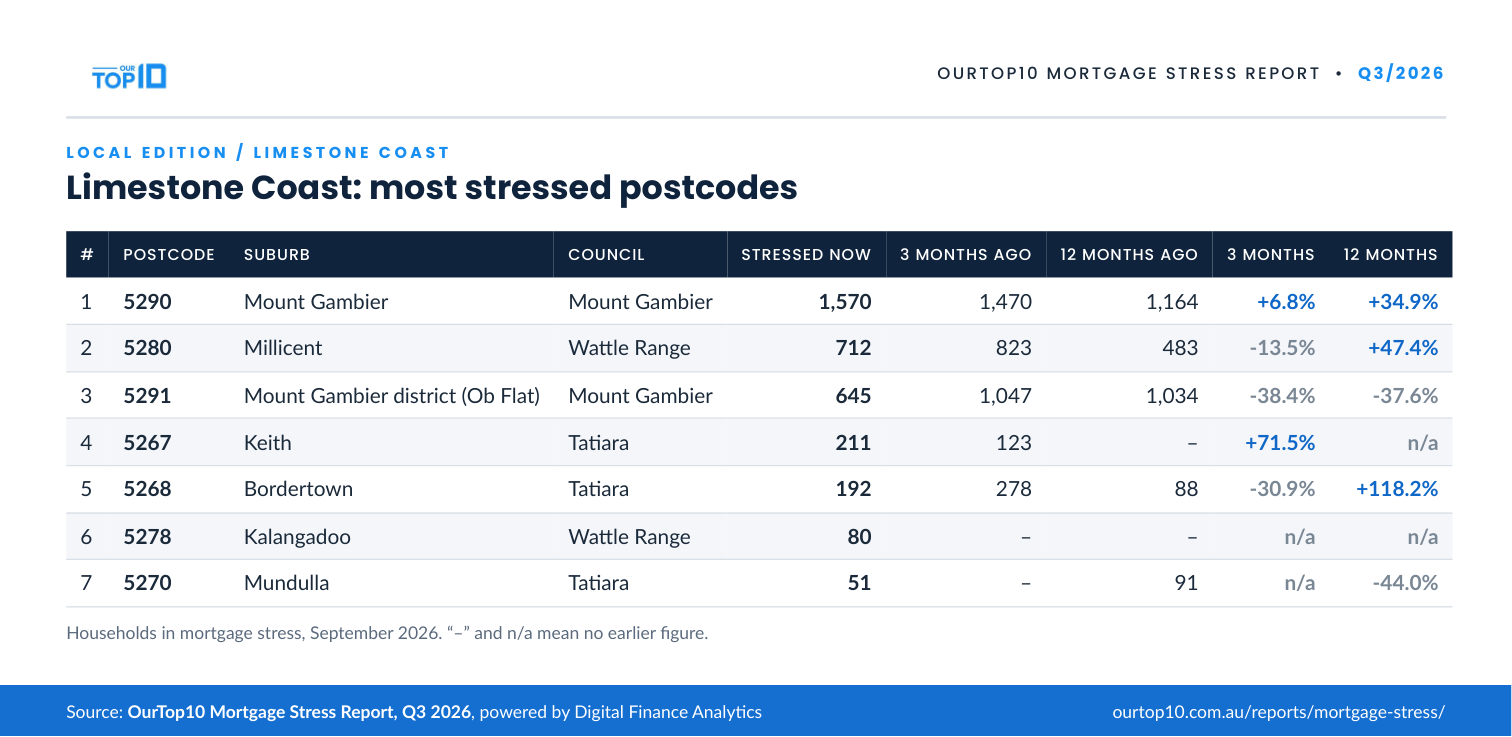
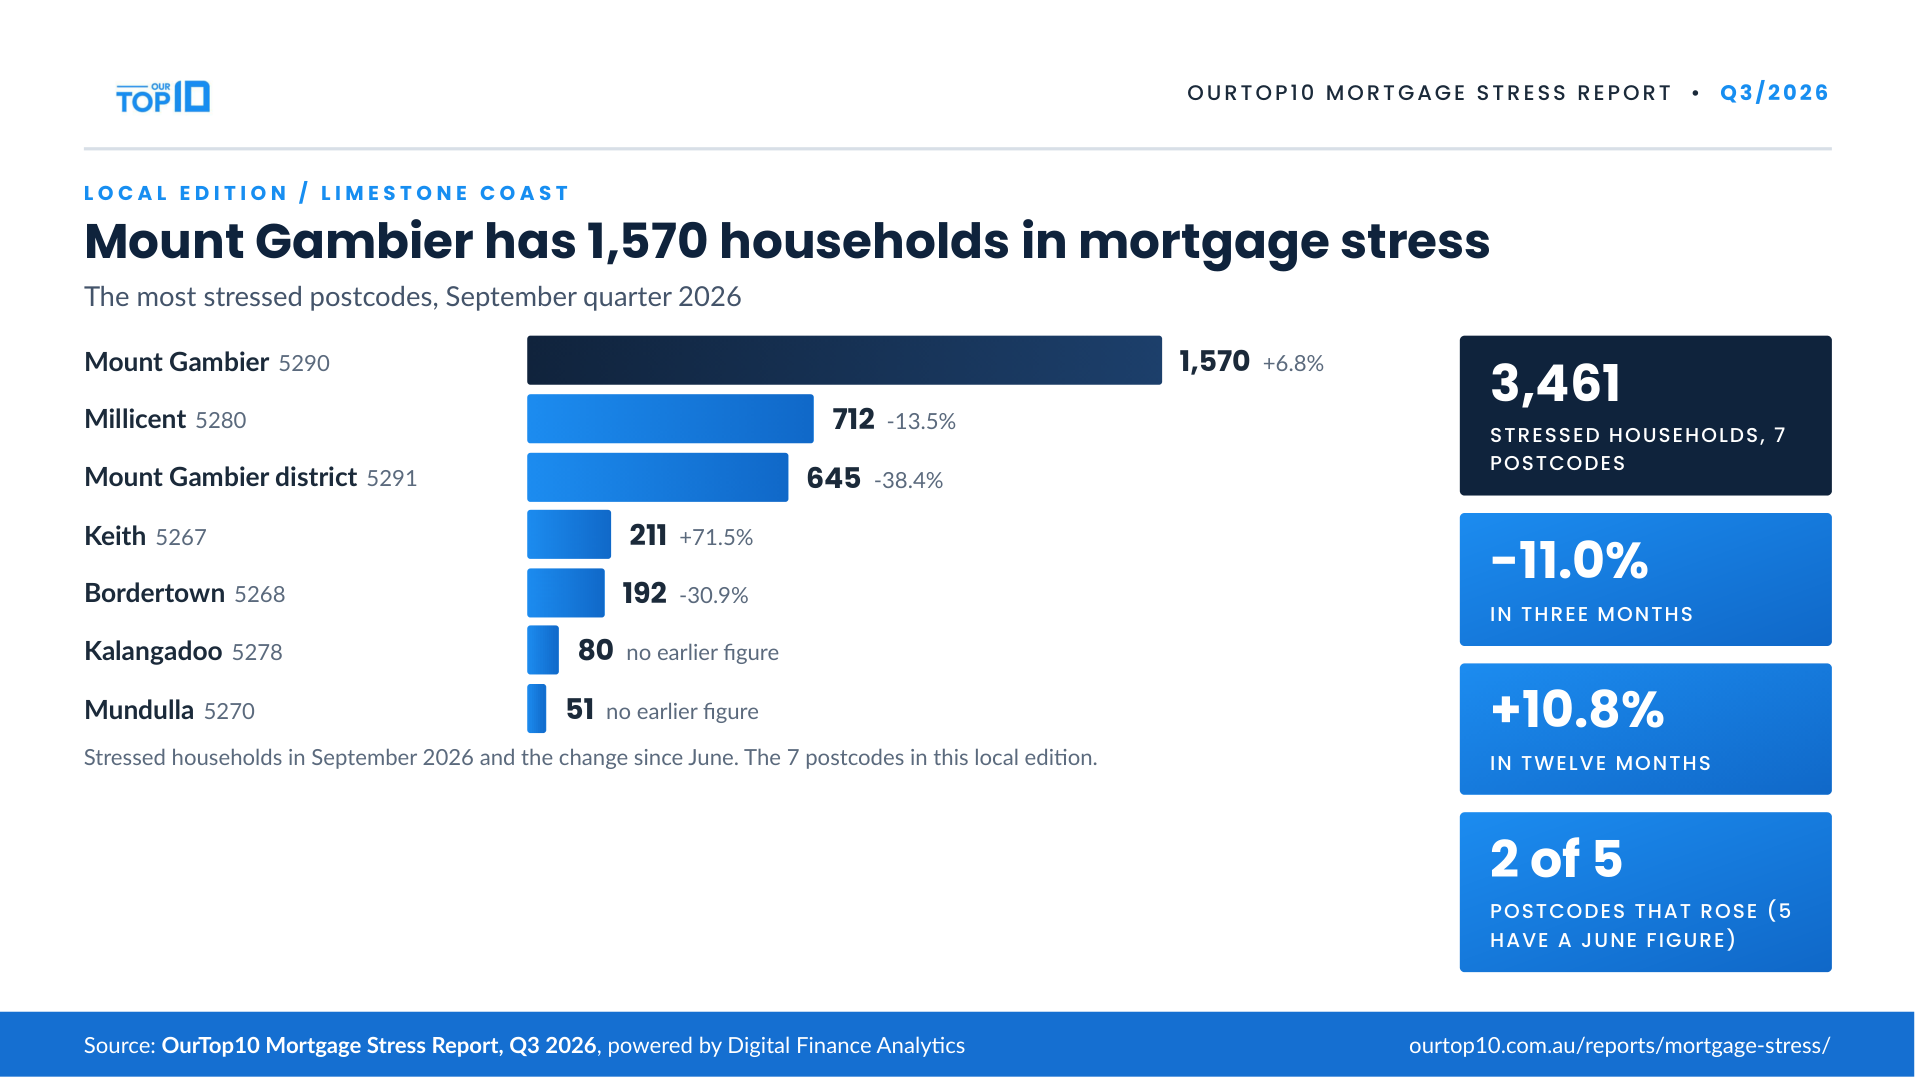
Free to publish with credit to the OurTop10 Mortgage Stress Report. Click the picture for the full-size file.
Limestone Coast – most stressed postcodes
| # | Postcode | Suburb | Council | Stressed now | 3 mos ago | 12 mos ago | Qtr change | Annual change |
|---|---|---|---|---|---|---|---|---|
| 1 | 5290 | Mount Gambier | Mount Gambier | 1,570 | 1,470 | 1,164 | ▲ +6.8% | ▲ +34.9% |
| 2 | 5280 | Millicent | Wattle Range | 712 | 823 | 483 | ▼ -13.5% | ▲ +47.4% |
| 3 | 5291 | Mount Gambier district (Ob Flat) | Mount Gambier | 645 | 1,047 | 1,034 | ▼ -38.4% | ▼ -37.6% |
| 4 | 5267 | Keith | Tatiara | 211 | 123 | – | ▲ +71.5% | n/a* |
| 5 | 5268 | Bordertown | Tatiara | 192 | 278 | 88 | ▼ -30.9% | ▲ +118.2% |
| 6 | 5278 | Kalangadoo | Wattle Range | 80 | – | – | n/a* | n/a* |
| 7 | 5270 | Mundulla | Tatiara | 51 | – | 91 | n/a* | ▼ -44.0% |
Ranked by households in mortgage stress, September 2026. Changes compare postcodes that have a figure in both periods; n/a* means no earlier figure. Small postcodes have small survey samples, so their numbers swing more. Figures are scaled up from a survey of about 4,500 households a month, so a suburb with no survey responses this quarter is not listed.
“While home prices are still below prices in the main centres, income growth has stalled, and costs are rising fast – especially extra costs relating to extended travel, as the fuel prices have risen.”
“Mortgage stress is not only a capital city story. Mount Gambier has about 400 more stressed households than it did a year ago, and Millicent is up almost half.”
Fleurieu Peninsula and southern Onkaparinga: local edition
18,476 households are in mortgage stress across thirteen postcodes from Morphett Vale to Yankalilla. The total is 11.4% higher than a year ago, though it eased 3.1% this quarter.
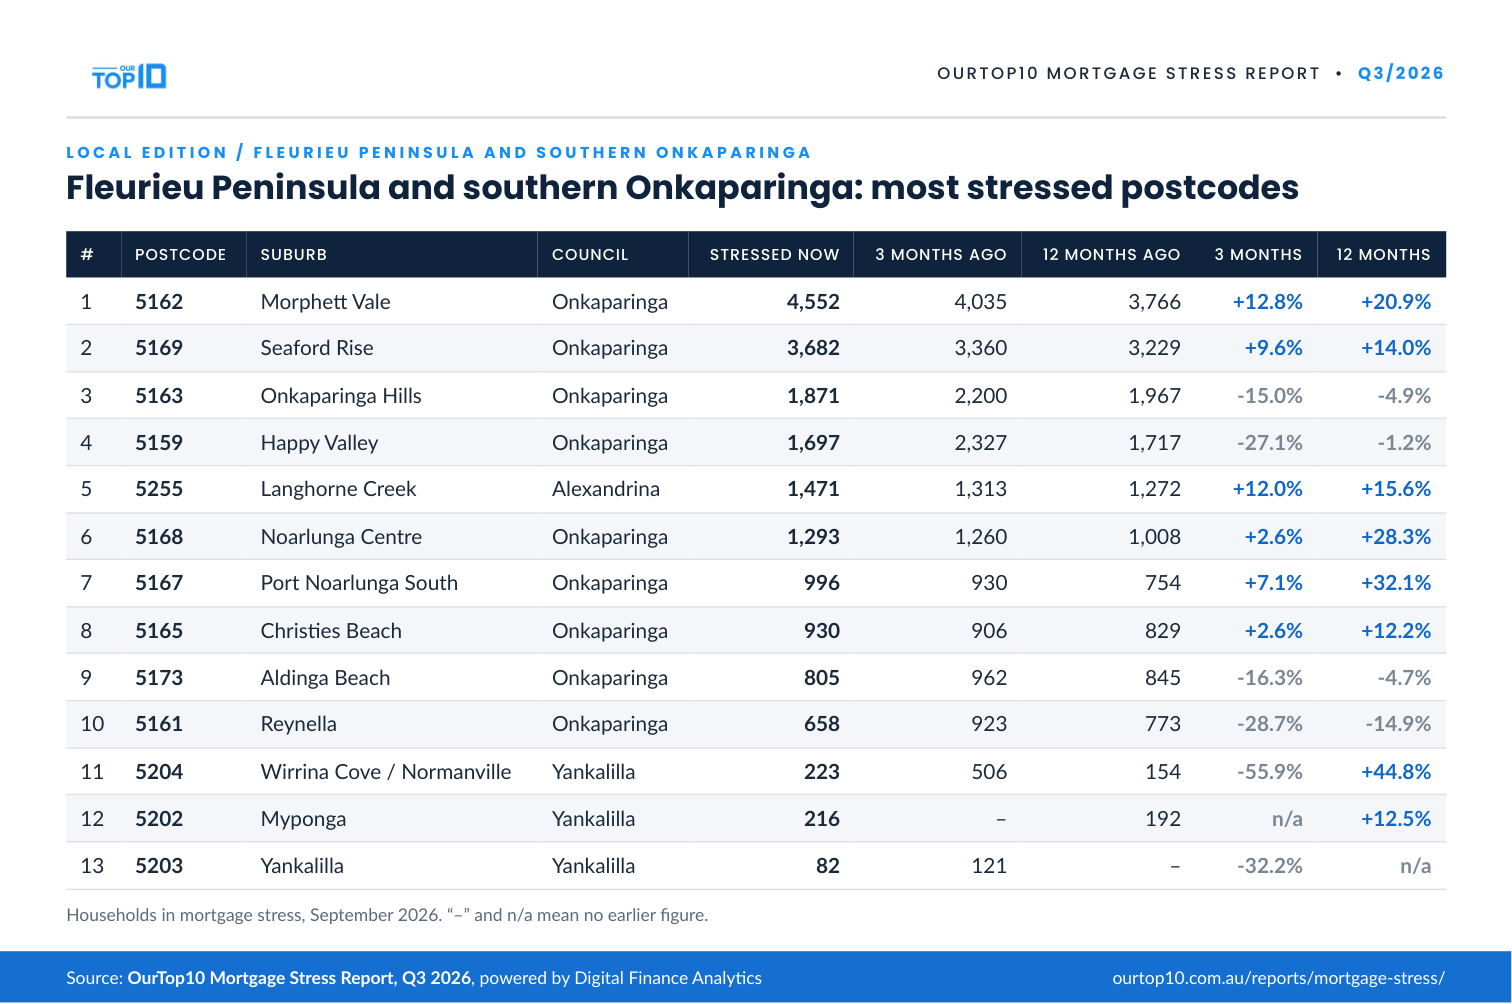
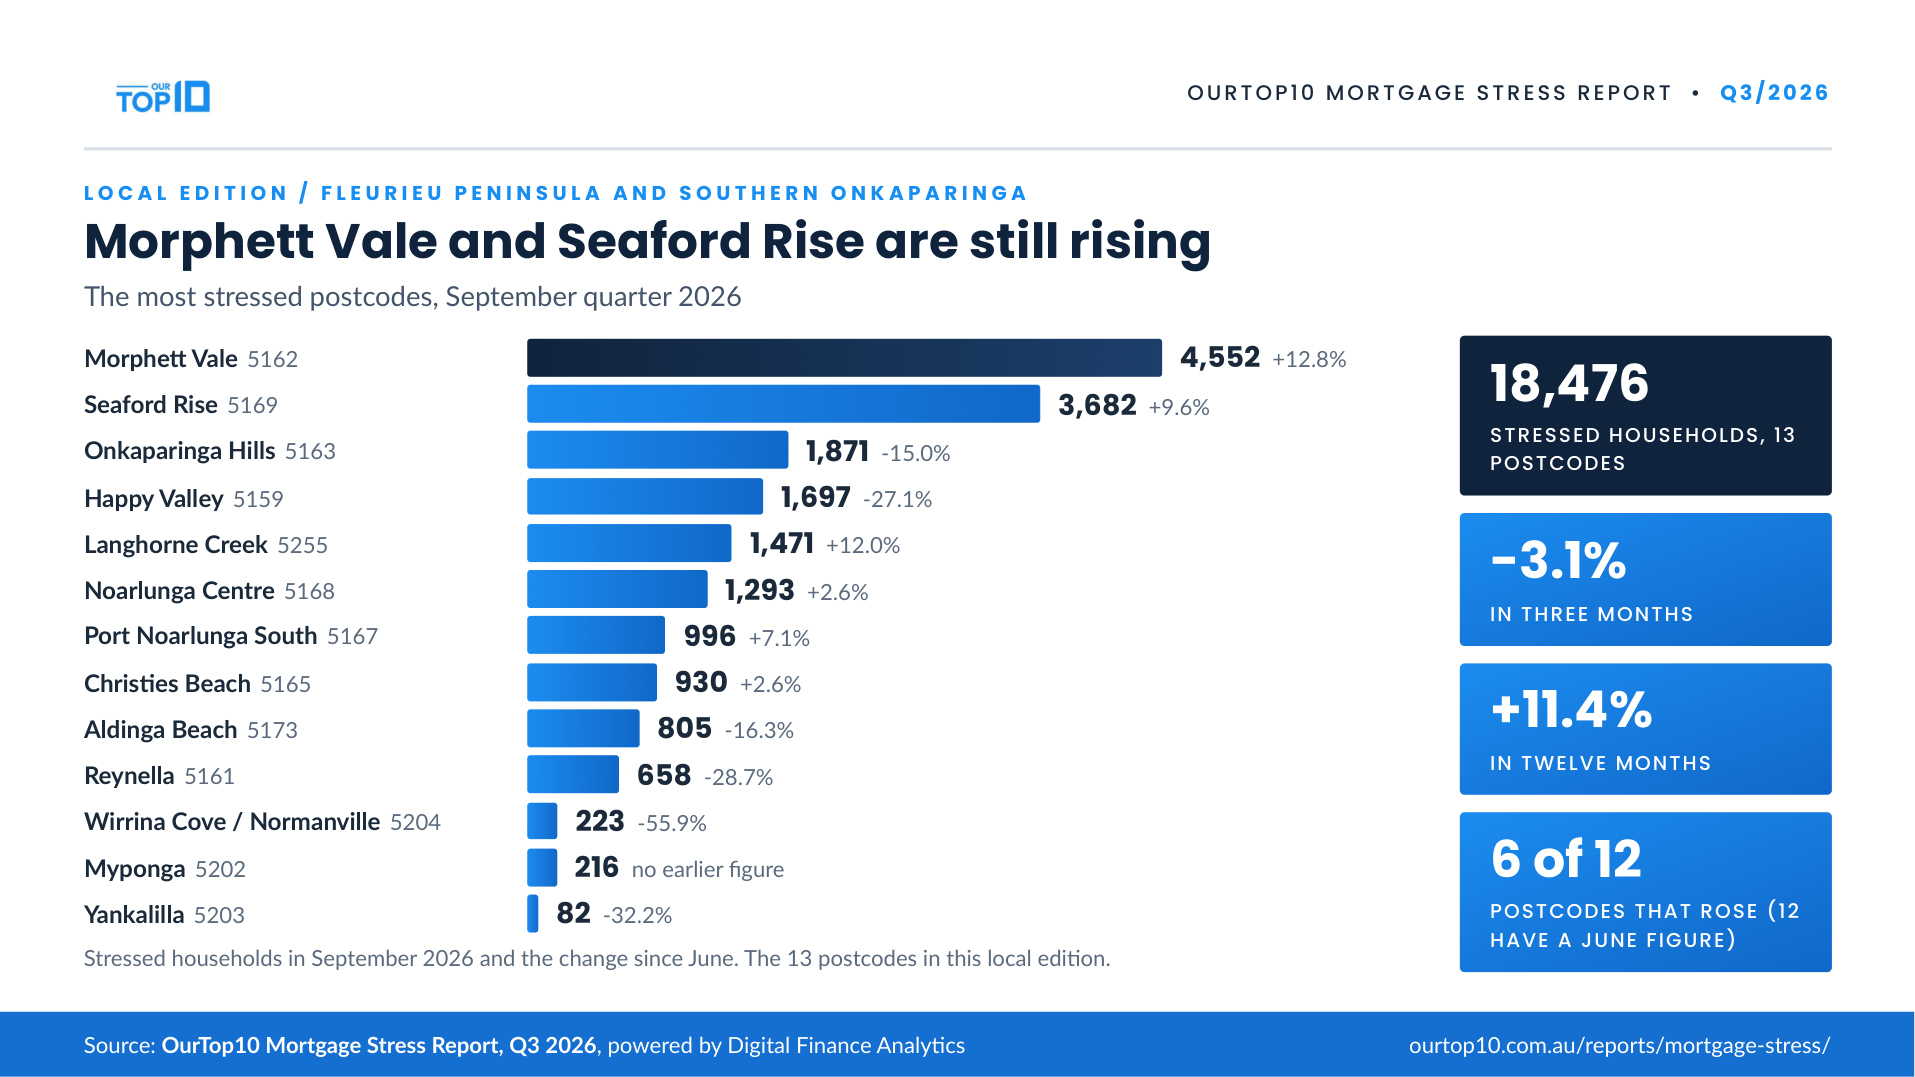
Free to publish with credit to the OurTop10 Mortgage Stress Report. Click the picture for the full-size file.
Fleurieu Peninsula and southern Onkaparinga – most stressed postcodes
| # | Postcode | Suburb | Council | Stressed now | 3 mos ago | 12 mos ago | Qtr change | Annual change |
|---|---|---|---|---|---|---|---|---|
| 1 | 5162 | Morphett Vale | Onkaparinga | 4,552 | 4,035 | 3,766 | ▲ +12.8% | ▲ +20.9% |
| 2 | 5169 | Seaford Rise | Onkaparinga | 3,682 | 3,360 | 3,229 | ▲ +9.6% | ▲ +14.0% |
| 3 | 5163 | Onkaparinga Hills | Onkaparinga | 1,871 | 2,200 | 1,967 | ▼ -15.0% | ▼ -4.9% |
| 4 | 5159 | Happy Valley | Onkaparinga | 1,697 | 2,327 | 1,717 | ▼ -27.1% | ▼ -1.2% |
| 5 | 5255 | Langhorne Creek | Alexandrina | 1,471 | 1,313 | 1,272 | ▲ +12.0% | ▲ +15.6% |
| 6 | 5168 | Noarlunga Centre | Onkaparinga | 1,293 | 1,260 | 1,008 | ▲ +2.6% | ▲ +28.3% |
| 7 | 5167 | Port Noarlunga South | Onkaparinga | 996 | 930 | 754 | ▲ +7.1% | ▲ +32.1% |
| 8 | 5165 | Christies Beach | Onkaparinga | 930 | 906 | 829 | ▲ +2.6% | ▲ +12.2% |
| 9 | 5173 | Aldinga Beach | Onkaparinga | 805 | 962 | 845 | ▼ -16.3% | ▼ -4.7% |
| 10 | 5161 | Reynella | Onkaparinga | 658 | 923 | 773 | ▼ -28.7% | ▼ -14.9% |
| 11 | 5204 | Wirrina Cove / Normanville | Yankalilla | 223 | 506 | 154 | ▼ -55.9% | ▲ +44.8% |
| 12 | 5202 | Myponga | Yankalilla | 216 | – | 192 | n/a* | ▲ +12.5% |
| 13 | 5203 | Yankalilla | Yankalilla | 82 | 121 | – | ▼ -32.2% | n/a* |
Ranked by households in mortgage stress, September 2026. Changes compare postcodes that have a figure in both periods; n/a* means no earlier figure. Small postcodes have small survey samples, so their numbers swing more. Figures are scaled up from a survey of about 4,500 households a month, so a suburb with no survey responses this quarter is not listed.
“While home prices are still below prices in the main centres, income growth has stalled, and costs are rising fast – especially extra costs relating to extended travel, as the fuel prices have risen.”
“Morphett Vale and Seaford Rise both rose this quarter and are well up on a year ago. Between them that is more than 8,000 households spending more each month than they earn.”
Greater Perth: local edition
86,047 households are in mortgage stress across Perth’s twelve most stressed postcodes. That is up 10.0% in three months and 23.2% in a year, and ten of the twelve rose.
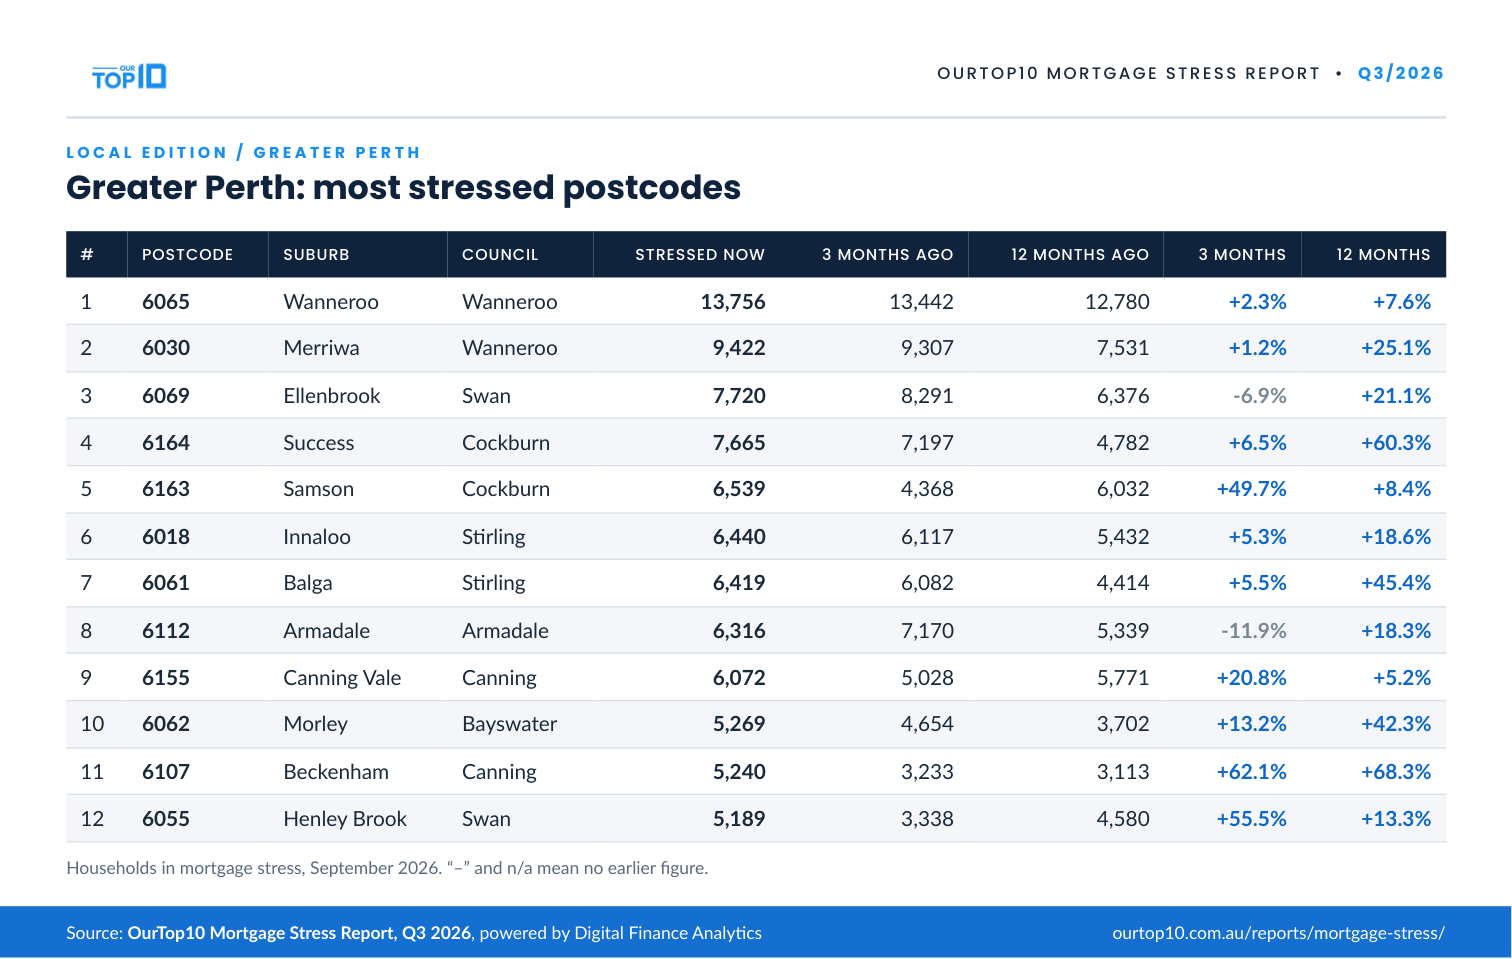
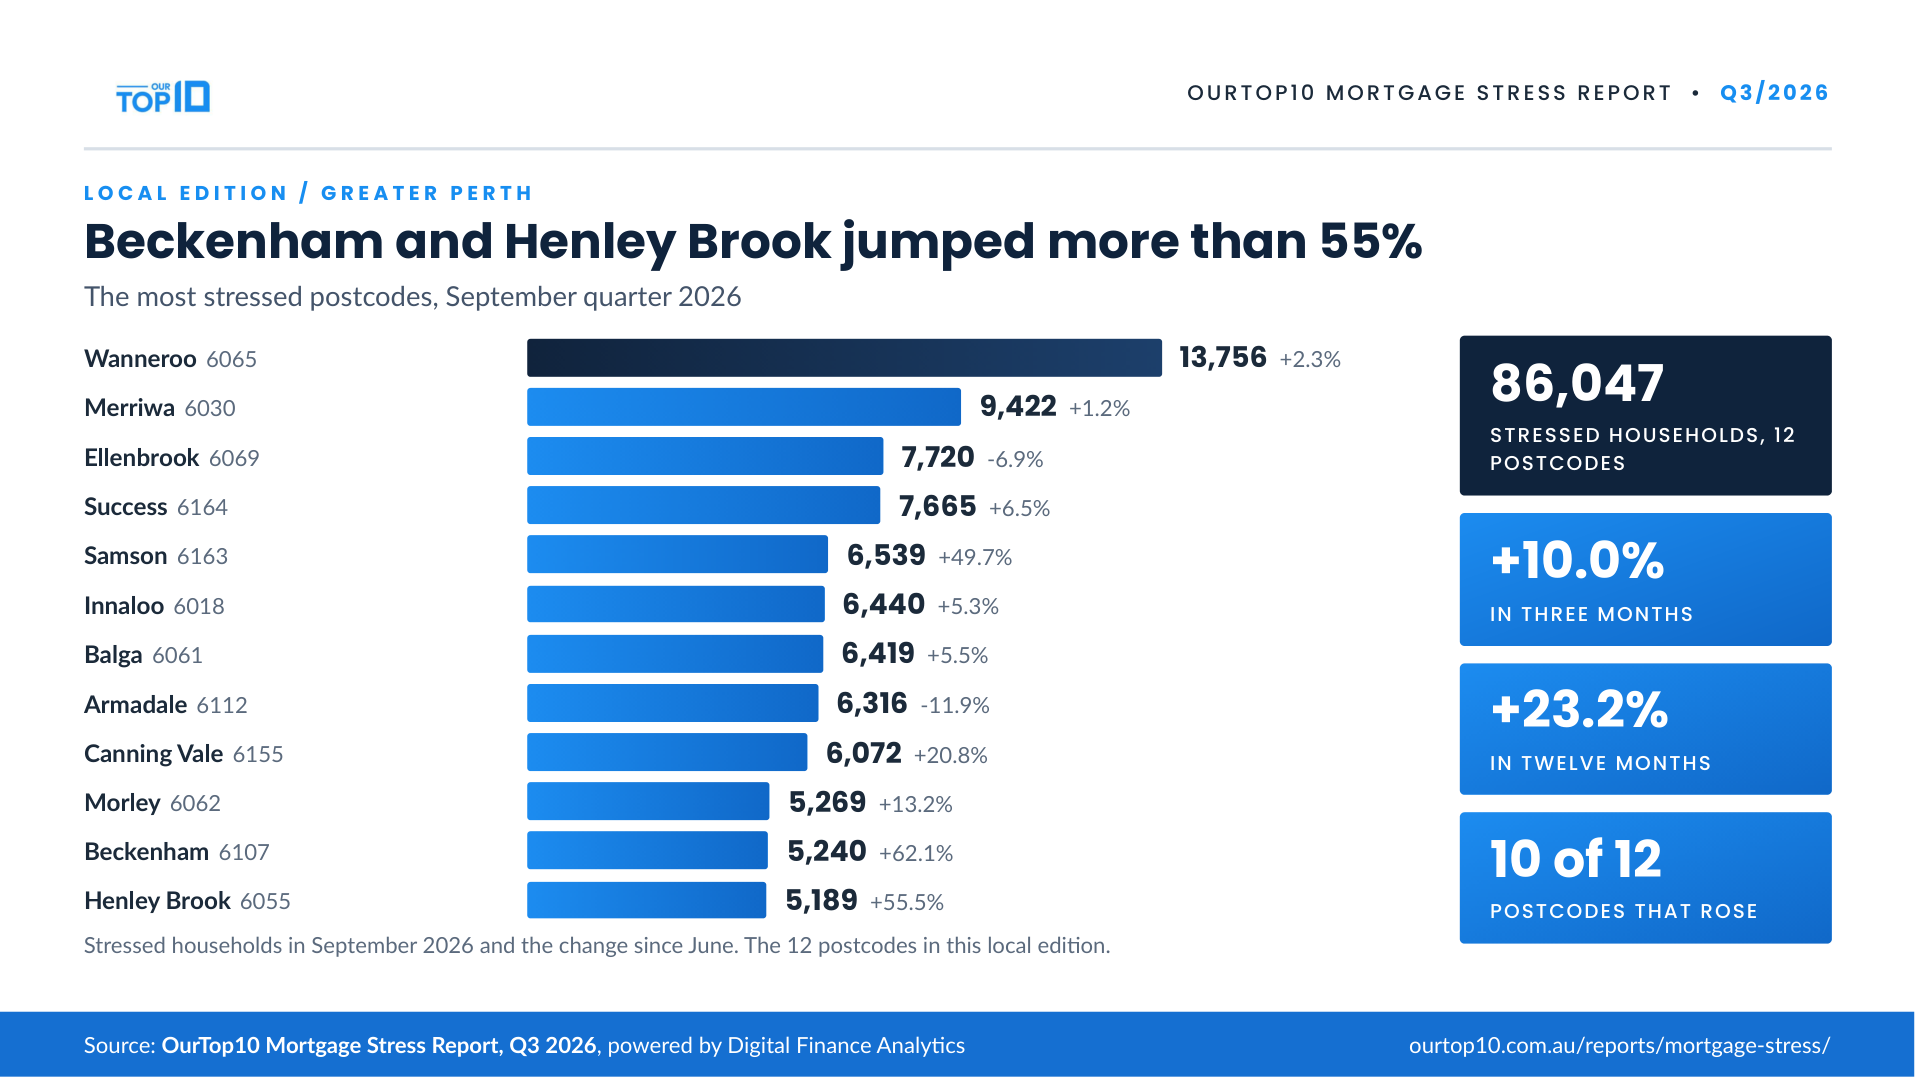
Free to publish with credit to the OurTop10 Mortgage Stress Report. Click the picture for the full-size file.
Greater Perth – most stressed postcodes
| # | Postcode | Suburb | Council | Stressed now | 3 mos ago | 12 mos ago | Qtr change | Annual change |
|---|---|---|---|---|---|---|---|---|
| 1 | 6065 | Wanneroo | Wanneroo | 13,756 | 13,442 | 12,780 | ▲ +2.3% | ▲ +7.6% |
| 2 | 6030 | Merriwa | Wanneroo | 9,422 | 9,307 | 7,531 | ▲ +1.2% | ▲ +25.1% |
| 3 | 6069 | Ellenbrook | Swan | 7,720 | 8,291 | 6,376 | ▼ -6.9% | ▲ +21.1% |
| 4 | 6164 | Success | Cockburn | 7,665 | 7,197 | 4,782 | ▲ +6.5% | ▲ +60.3% |
| 5 | 6163 | Samson | Cockburn | 6,539 | 4,368 | 6,032 | ▲ +49.7% | ▲ +8.4% |
| 6 | 6018 | Innaloo | Stirling | 6,440 | 6,117 | 5,432 | ▲ +5.3% | ▲ +18.6% |
| 7 | 6061 | Balga | Stirling | 6,419 | 6,082 | 4,414 | ▲ +5.5% | ▲ +45.4% |
| 8 | 6112 | Armadale | Armadale | 6,316 | 7,170 | 5,339 | ▼ -11.9% | ▲ +18.3% |
| 9 | 6155 | Canning Vale | Canning | 6,072 | 5,028 | 5,771 | ▲ +20.8% | ▲ +5.2% |
| 10 | 6062 | Morley | Bayswater | 5,269 | 4,654 | 3,702 | ▲ +13.2% | ▲ +42.3% |
| 11 | 6107 | Beckenham | Canning | 5,240 | 3,233 | 3,113 | ▲ +62.1% | ▲ +68.3% |
| 12 | 6055 | Henley Brook | Swan | 5,189 | 3,338 | 4,580 | ▲ +55.5% | ▲ +13.3% |
Ranked by households in mortgage stress, September 2026. Changes compare postcodes that have a figure in both periods; n/a* means no earlier figure. Figures are scaled up from a survey of about 4,500 households a month, so a suburb with no survey responses this quarter is not listed. This list is Greater Perth only; the WA state edition ranks the whole state, including Bunbury, so its totals differ.
Severe mortgage stress: Mount Claremont (6010) 2,364, no earlier figure; Wembley (6014) 1,636, no earlier figure; Cottesloe (6011) 1,155, from 1,125 three months ago; City Beach (6015) 1,012, no earlier figure.
“Next time, we expect stress to go higher still and continue to spread. We are at a tipping point.”
“Beckenham and Henley Brook both jumped more than 55% in three months, and ten of the twelve Perth postcodes on this list went up. That is a lot of households whose bills now outrun their income.”
Severe mortgage stress
The fastest-growing severe-stress postcodes this quarter are mostly established and affluent suburbs rather than outer growth corridors. Drummoyne (NSW 2047) rose 610%, from 224 to 1,591 households. Hornsby (+289%) and Elwood (+256%) followed. Bondi Beach (NSW 2026) is the largest severe-stress hotspot across the four states covered, at 3,710 households.
Top 10 severe stress risers – national
| # | Postcode | Suburb | Market | Severe now | 3 mos ago | Qtr change |
|---|---|---|---|---|---|---|
| 1 | 2047 | Drummoyne | Sydney/NSW | 1,591 | 224 | ▲ +610% |
| 2 | 2077 | Hornsby | Sydney/NSW | 1,555 | 400 | ▲ +289% |
| 3 | 3184 | Elwood | Melbourne/VIC | 1,989 | 558 | ▲ +256% |
| 4 | 3122 | Hawthorn | Melbourne/VIC | 1,499 | 624 | ▲ +140% |
| 5 | 6153 | Mount Pleasant | Perth/WA | 657 | 311 | ▲ +111% |
| 6 | 4218 | Mermaid Waters | Brisbane/QLD | 515 | 244 | ▲ +111% |
| 7 | 4007 | Ascot | Brisbane/QLD | 392 | 209 | ▲ +88% |
| 8 | 2070 | Lindfield | Sydney/NSW | 1,813 | 980 | ▲ +85% |
| 9 | 3124 | Camberwell | Melbourne/VIC | 2,025 | 1,118 | ▲ +81% |
| 10 | 6008 | Subiaco | Perth/WA | 667 | 421 | ▲ +58% |
Ranked by quarterly percentage change in severely stressed households. Postcodes with no prior-quarter reading are excluded; movements off small bases can be volatile. The September extract carries severe-stress lists for NSW, Victoria, Queensland and WA only.
Who is under pressure
Methodology
The data comes from research by Digital Finance Analytics (DFA) and is based on a simple idea: what matters isn’t how much of your income goes to your mortgage — it’s whether you have any money left at the end of the month.
Mortgage stress refers to owner-occupier households in negative monthly cash flow, where regular expenses — including utilities, insurance, transport and day-to-day living costs — exceed income. That’s a different lens to the usual ‘30% of income’ rule, and it tends to reflect real pressure more accurately.
Data is captured from a rolling survey of around 4,500 households each month, scaled to the broader population and aligned with Census and lending data. Analysis is at postcode level; smaller areas can be less reliable, and percentage moves off small bases can be volatile. Figures reflect each state/territory’s top 10 ranked postcodes, which extend beyond strict metro boundaries. Suburb and LGA pairings are DFA representative localities derived from ABS statistical zones, not 1:1 postcode matches.
* n/a: no prior-period figure available, so a percentage change cannot be calculated. Tasmania’s September extract lists seven distinct postcodes (three entries were repeated in the source data), so the index covers 77 postcodes this quarter. National totals include ten Northern Territory postcodes, which are not reported separately this quarter.
FAQs
What is mortgage stress?
Mortgage stress refers to owner-occupier households in negative monthly cash flow — where regular expenses, including mortgage repayments, exceed income.
What is the difference between mortgage stress and severe mortgage stress?
Mortgage stress means a household's monthly outgoings, including the mortgage, exceed its income — it is cash-flow negative but generally still paying. Severe mortgage stress means that gap is deep and ongoing, and the household has already fallen behind on repayments, is trying to refinance, has asked its lender for hardship help, or is selling. Severe stress is a subset of mortgage stress.
Why might DFA mortgage stress results differ from other datasets?
DFA's model measures household financial pressure at a cash-flow level — whether regular income covers all ongoing expenses, not just mortgage repayments. Unlike the common '30% of gross income' rule, it identifies households running at a cash-flow deficit after all major living costs, which can produce different results to narrower surveys.
Is the data based on actual household data, modelling, or both?
Both. Around 4,500 households are surveyed each month, a rolling base of about 52,000 or roughly 0.5% of households, optimised against Census data, migration trends and postcode-level demographics, then scaled to Australia's roughly 10 million households and benchmarked against Census and RBA lending exposure data.
Why do some postcodes show close to 100% of mortgaged households in stress?
As a postcode approaches the upper bound, the model reports approximately 100% (with a margin of roughly ±2% depending on sample size). In those postcodes the quarterly change tracks the change in the number of borrowing households.
Why are the state lists not limited to the capital city?
The ranking covers the whole state or territory. Where a regional postcode has more stressed households than a metropolitan one, it ranks ahead of it — which is why Toowoomba, Cairns, Launceston and Tamworth appear in their state lists.
Downloads & media
All data in this report was produced by Digital Finance Analytics and is reproduced with permission. When reporting on these findings, please attribute to “the OurTop10 Mortgage Stress Report, powered by Digital Finance Analytics” and link to https://ourtop10.com.au/reports/mortgage-stress/.
Download the national report (PDF) Journalist cheat sheet — the report on one page Media kit — cheat sheet, city one-pagers + infographics Full pack — all eight PDFs, tables + infographicsState and territory editions
Data files
Media contact: Mansour Soltani, Head of Research · 0405 500 981 · [email protected]
Previous releases
Mortgage Stress Report — Q2 2026 · Mortgage Stress Report — Q1 2026
Where this report has been covered
Coverage of the Q3 2026 report:
- Aussie Real Estate Podcast — Australian Mortgage Stress: 450,000+ Households Spending More Than They Earn
Coverage of the Q2 2026 report:
- News24 — Hundreds of thousands of Australians now living beyond their means as mortgage stress explodes
- Australian Broker — Suburbs with the highest mortgage stress
- Australian Broker — Blue-chip borrowers now on the front line of mortgage stress
- MPA Magazine — Mortgage stress spreads to Australia's affluent suburbs
- realestate.com.au — Sydney suburbs hollowing out as thousands flee soaring housing costs
- Elite Agent — Over 52,000 extra Aussie homes plunge into mortgage stress as financial squeeze hits blue-chip suburbs
- Property Buzz — Sydney's blue-chip suburb is Australia's fastest-rising severe mortgage stress hotspot
- Pulse Tasmania — Kingston records biggest mortgage stress jump of any postcode in Australia